
Smart Money Concepts (SMC): The Complete Mastery Guide for Stock Traders (2026)
Master Smart Money Concepts in 2026. Learn order blocks, fair value gaps, liquidity sweeps, BOS, CHoCH, and how to trade alongside institutions — not against them.
Introduction
Every retail trader has experienced the same frustrating pattern.
You identify a clean setup. Support is clear. The chart looks perfect. You enter. Price moves a few points in your direction — then reverses sharply, blows through your stop loss, and continues exactly where you originally expected it to go. Without you.
That wasn't bad luck. That was Smart Money.
Smart Money Concepts (SMC) is the framework that explains why this happens — and more importantly, how to stop being the trader who gets stopped out and start being the one positioned correctly when the real move begins.
This guide covers everything. From the foundational theory of how institutions operate, through every core SMC concept — market structure, order blocks, fair value gaps, liquidity sweeps, inducement, the Power of 3 — to a complete step-by-step trade execution framework you can apply to stocks starting today.
By the time you finish this guide, the market will never look the same again.
TL;DR — Key Takeaways
- Smart Money (institutions, banks, hedge funds) controls price — SMC teaches you to read their footprints
- Market structure (BOS and CHoCH) is the foundation — never trade without knowing it
- Liquidity is the engine of all price movement — stops are targets, not protection
- Order blocks are institutional footprints — high-probability zones where price frequently reverses
- Fair value gaps fill approximately 70% of the time — one of the most reliable setups in SMC
- The full SMC trade follows a 5-step framework: structure — liquidity — zone — confirmation — entry
- Risk management determines long-term survival — no SMC concept overrides proper position sizing
Part 1: What Are Smart Money Concepts — And Why They Work
The Problem with Traditional Technical Analysis
Most retail traders learn the same technical analysis. Support and resistance. Moving averages. RSI. Chart patterns. They draw the same lines, set stops at the same levels, and enter at the same breakout points.
This is precisely the problem.
When millions of retail traders are looking at the same levels and making the same decisions, those decisions become predictable. And predictable retail behavior creates something that large institutions need more than anything else: liquidity.
Who Is "Smart Money"?
Smart Money refers to the professional capital controlled by:
- Major banks (Goldman Sachs, JPMorgan, Morgan Stanley)
- Hedge funds (Bridgewater, Renaissance Technologies, Citadel)
- Institutional asset managers (BlackRock, Vanguard)
- Market makers and proprietary trading firms
These players have advantages retail traders will never match: superior information, massive capital, direct market access, and teams of quantitative analysts. But their greatest challenge is one that retail traders never face — size.
When an institution wants to buy $500 million worth of a stock, it cannot simply click buy. An order that size would immediately move price against them, creating enormous slippage before the position is even filled. Instead, institutions must:
- Accumulate positions gradually, often over days or weeks
- Engineer price movements to generate the liquidity they need
- Disguise their activity within normal price action
- Distribute (sell) positions in the same patient, methodical way
Smart Money Concepts is the framework that teaches you to recognize these institutional operations on a price chart — and trade alongside them rather than against them.
The Origin of SMC: ICT and the Retail Evolution
SMC as a structured methodology originates primarily from the work of Michael J. Huddleston, known in trading communities as ICT (Inner Circle Trader). Building on Richard Wyckoff's century-old institutional analysis framework, ICT developed a detailed system of concepts — order blocks, fair value gaps, killzones, and the Power of 3 — that gave retail traders a vocabulary for institutional behavior.
The SMC community evolved these concepts further, standardizing terminology and building upon ICT's foundations. Today, SMC and ICT are used near-interchangeably, with SMC referring to the broader community-evolved framework.
Pro Tip: You don't need to choose between SMC and traditional technical analysis. SMC explains why traditional levels work — support and resistance zones often align exactly with order blocks, and breakouts often follow liquidity sweeps. Understanding both frameworks deepens your analysis.
Does SMC Actually Work? The Data
Backtesting provides the most honest answer. A 2026 study of 2,600 SMC trades found that fair value gaps fill approximately 70% of the time, making them one of the most statistically reliable patterns available to retail traders. Order blocks showed a comparable hit rate when properly identified — meaning they met all three required criteria (last opposing candle before displacement, clear BOS, and FVG within the impulse).
The critical caveat: SMC setups that appeared outside institutional trading hours (killzones) had dramatically lower win rates. The framework works — but only when applied with discipline, in the right market conditions, at the right time.
Part 2: Market Structure — The Absolute Foundation
If SMC is a building, market structure is its concrete foundation. Every other concept in this guide depends on your ability to read market structure correctly.
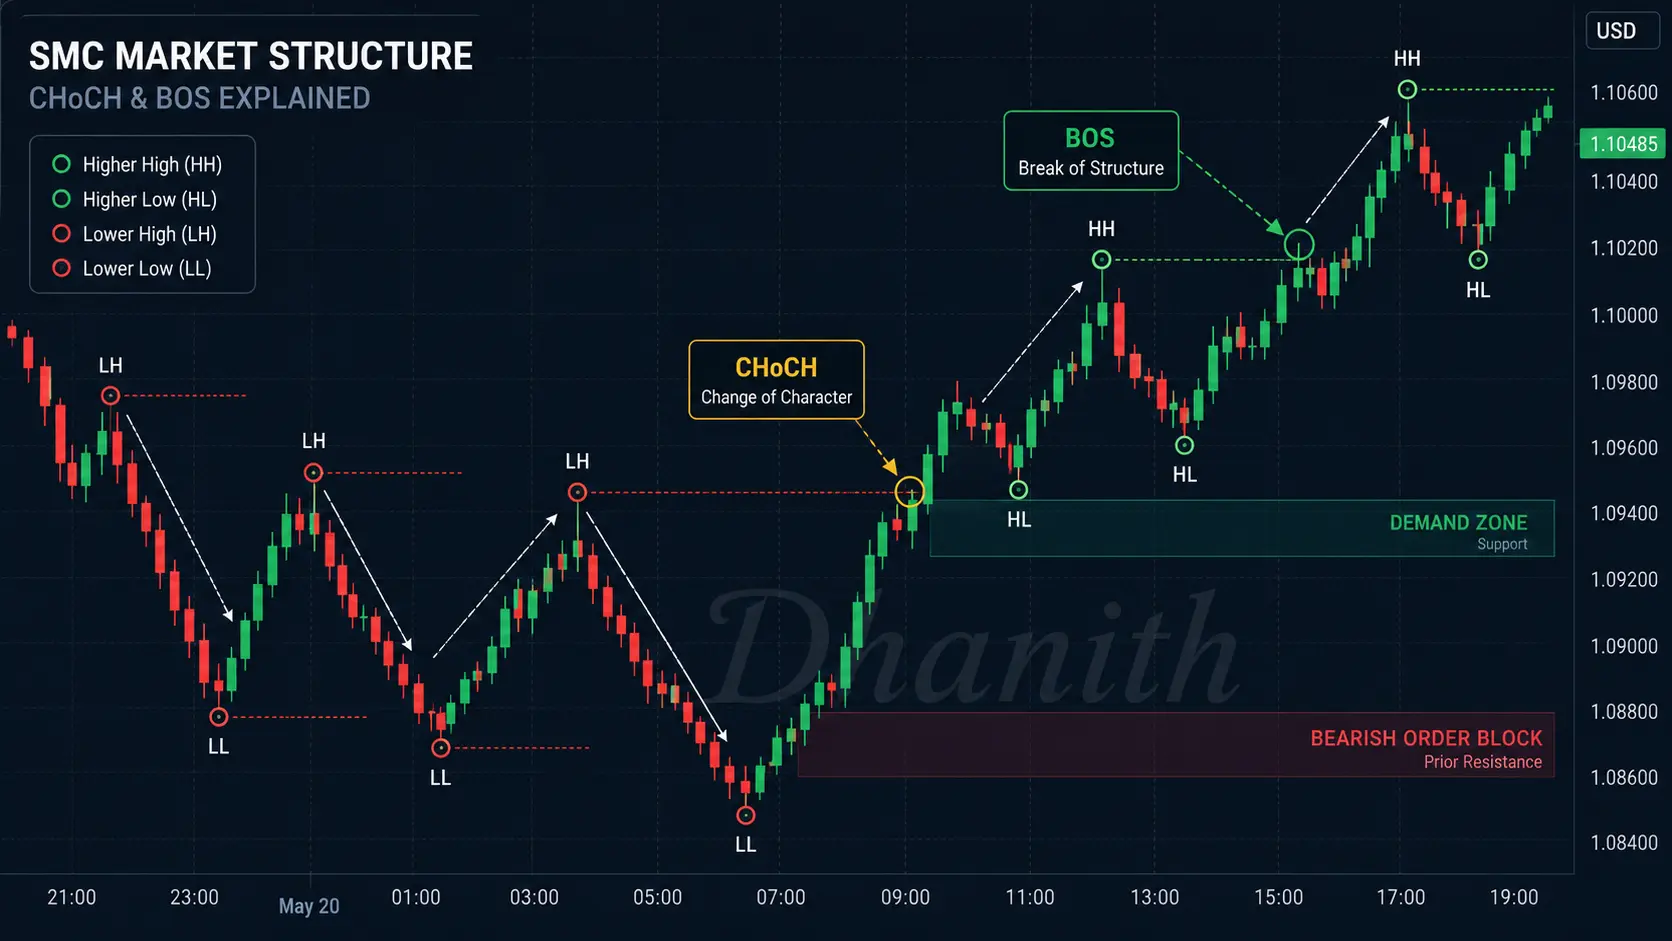
Higher Highs, Higher Lows, Lower Highs, Lower Lows
Market structure begins with swing points — the peaks and troughs that price creates as it moves.
In a bullish market structure:
- Price creates Higher Highs (HH) — each rally exceeds the previous peak
- Price creates Higher Lows (HL) — each pullback holds above the previous low
- The overall direction is up. Institutions are accumulating. You look for longs.
In a bearish market structure:
- Price creates Lower Highs (LH) — each rally fails below the previous peak
- Price creates Lower Lows (LL) — each pullback breaks below the previous low
- The overall direction is down. Institutions are distributing. You look for shorts.
The crucial discipline: always identify structure on the higher timeframe first. The daily chart's structure overrides the 1-hour chart. The weekly overrides the daily. If the daily trend is bearish, a bullish 15-minute signal is counter-trend and carries much lower probability.
Break of Structure (BOS) — Trend Continuation
A Break of Structure (BOS) occurs when price breaks beyond a significant swing point in the direction of the existing trend.
- In an uptrend: price breaks above the previous Higher High — bullish BOS — trend continuation confirmed
- In a downtrend: price breaks below the previous Lower Low — bearish BOS — trend continuation confirmed
A BOS tells you the trend is alive and institutions are still pushing in the current direction. When you see a BOS, you look to enter on the next pullback — ideally at an order block or fair value gap left by the move that caused the break.
What a BOS is not: A BOS is not a random wick through a level. It requires a candle close beyond the swing point for confirmation. Wicks that pierce and retrace are often liquidity sweeps — a different concept we'll cover shortly.
Change of Character (CHoCH) — The First Reversal Signal
A Change of Character (CHoCH) is the most important early warning signal in SMC. It occurs when price breaks structure against the current trend for the first time.
- In an uptrend: price breaks below a recent Higher Low — bearish CHoCH — potential reversal beginning
- In a downtrend: price breaks above a recent Lower High — bullish CHoCH — potential reversal beginning
The key word is "potential." A CHoCH does not guarantee reversal — it signals that the trend's momentum has shifted and you should begin looking for reversal setups rather than continuation trades. It's the market's first admission that something has changed.
Warning: A CHoCH could signal a full trend reversal, or it could simply mark a transition to a ranging market before the original trend resumes. Never trade a CHoCH alone. Wait for confirmation — a second structural shift, a liquidity sweep, or a reaction at a key zone — before committing.
Strong vs. Weak Structure Points
Not all swing highs and lows are equal. SMC distinguishes between:
Strong highs/lows: Created when price aggressively breaks through a previous level — a clean, impulsive move that leaves little doubt about direction. These are likely to hold when tested.
Weak highs/lows: Created by a slow, grinding move that barely exceeds a previous level. These are more likely to break when retested.
The practical application: when price returns to test a previous swing point, a strong level is a better location for a trade entry than a weak one. Strong levels have genuine institutional interest behind them.
Part 3: Liquidity — The Engine of All Price Movement
Understanding liquidity is the single biggest leap a retail trader can make. Once you genuinely internalize this concept, stop-outs that previously felt random begin to make complete sense.
What Is Liquidity in SMC?
Liquidity refers to the cluster of pending orders sitting in the market at specific price levels. These orders come from three primary sources:
- Stop losses — retail traders who are long place stops below support; traders who are short place stops above resistance
- Pending orders — breakout traders who set buy stops above swing highs and sell stops below swing lows
- Limit orders — traders waiting to enter at specific price targets
From an institutional perspective, these clusters of orders are not a threat — they're an opportunity. Institutions need massive liquidity to fill their own enormous orders. The most reliable liquidity pools sit exactly where retail traders place their stops.
Where Liquidity Pools Sit
The most significant liquidity pools are found:
- Above equal highs — when price creates two or more peaks at nearly the same level, retail traders recognize this as resistance and place their stops just above it. Institutions recognize this as a liquidity pool.
- Below equal lows — the inverse: two or more lows at similar levels create a pool of sell stops below
- Above/below obvious swing highs and lows — the more "obvious" a support or resistance level, the more stops are clustered there
- At round numbers — $50, $100, $150, $200 attract an outsized concentration of orders
- At prior all-time highs and lows — heavily watched levels with enormous stop concentrations
Liquidity Sweeps — The Stop Hunt Explained
A liquidity sweep (also called a stop hunt or liquidity raid) occurs when price temporarily moves beyond a significant level — triggering the stop losses and pending orders clustered there — before reversing sharply in the opposite direction.
This is not random market noise. This is institutions deliberately engineering a price move to:
- Trigger the stops of retail traders positioned in the direction they want to move
- Fill their own large orders against those triggered stops
- Then drive price in their intended direction — using the momentum of triggered orders as fuel
The visual signature of a liquidity sweep:
- A sharp, aggressive move beyond a key level (a swing high, equal highs, a round number)
- Often creating a prominent wick on the candle
- Followed immediately by an equally sharp reversal
- The reversal breaks structure in the opposite direction (CHoCH or BOS)
When you see this pattern — a spike beyond a key level followed by a sharp reversal with a structure break — you are likely watching institutional liquidity collection in real time.
Pro Tip: The most powerful SMC entries come from combining a liquidity sweep with an order block or fair value gap on a lower timeframe. The sweep collects liquidity — price returns to the institutional zone — you enter with the institution.
Buy-Side vs. Sell-Side Liquidity
Buy-side liquidity (BSL) sits above swing highs and equal highs. It consists of the stop losses of short sellers and the buy stops of breakout traders. Institutions seeking to sell their positions need this liquidity — they drive price up to collect it, then reverse downward.
Sell-side liquidity (SSL) sits below swing lows and equal lows. It consists of the stop losses of long traders and the sell stops of breakdown traders. Institutions seeking to buy need this liquidity — they drive price down to collect it, then reverse upward.
The pattern is consistent: price moves to where the most orders are before it moves where it's actually going. Understanding this eliminates the frustration of seeing price stop you out "by a few points" before reversing — that stop was the target, not an accident.
Inducement — The Setup Before the Setup
Inducement is one of the most sophisticated SMC concepts — and one of the most profitable when understood.
Inducement occurs when institutions engineer a deliberate false signal to draw retail traders into positions they intend to stop out, collecting liquidity in the process.
Here's how it works in a bullish institutional scenario:
Smart money wants to buy at a lower price. Rather than let price retrace cleanly to their desired level — which would allow retail traders to enter alongside them — they engineer a more convincing looking breakdown first.
Price drops below what looks like a valid Higher Low. Long traders get stopped out. Breakout traders go short, placing their stops above the recent high. With retail short positions now loaded, institutions drive price aggressively upward. The short stops trigger as buy orders, adding fuel to the rally. The "breakdown" was entirely engineered to collect the liquidity needed for the real move.
How to recognize inducement:
- A move that looks like a structure break but feels weak and lacks follow-through
- The break occurs into an area of obvious retail stop placement
- Price reverses sharply almost immediately after the "break"
- The reversal is significantly more impulsive than the initial breakdown
Warning: Inducement is why you should never enter immediately on the first break of structure. Wait for the market to show its hand — let the liquidity sweep happen, let price return to a valid zone, then enter on lower timeframe confirmation.
Part 4: Order Blocks — Institutional Footprints on the Chart
Order blocks are arguably the most widely discussed concept in SMC — and the most misapplied. Understanding what they truly represent, and how to identify them correctly, separates traders who use SMC profitably from those who don't.
What Is an Order Block?
An order block (OB) is the last opposite-colored candle before a significant impulsive move that breaks market structure. It represents the price zone where institutions placed large orders that initiated the move.
Think of it this way: when Goldman Sachs places a $300 million buy order, they cannot fill it all at once. They fill portions of it at different prices within a price range. That range — that cluster of institutional orders — is the order block. And because institutions rarely fill every order in a single move, they often return to that zone to fill remaining orders when price retraces.
This is why price so frequently returns to the candle just before a major move and reverses there — that's where the remaining institutional orders are waiting.
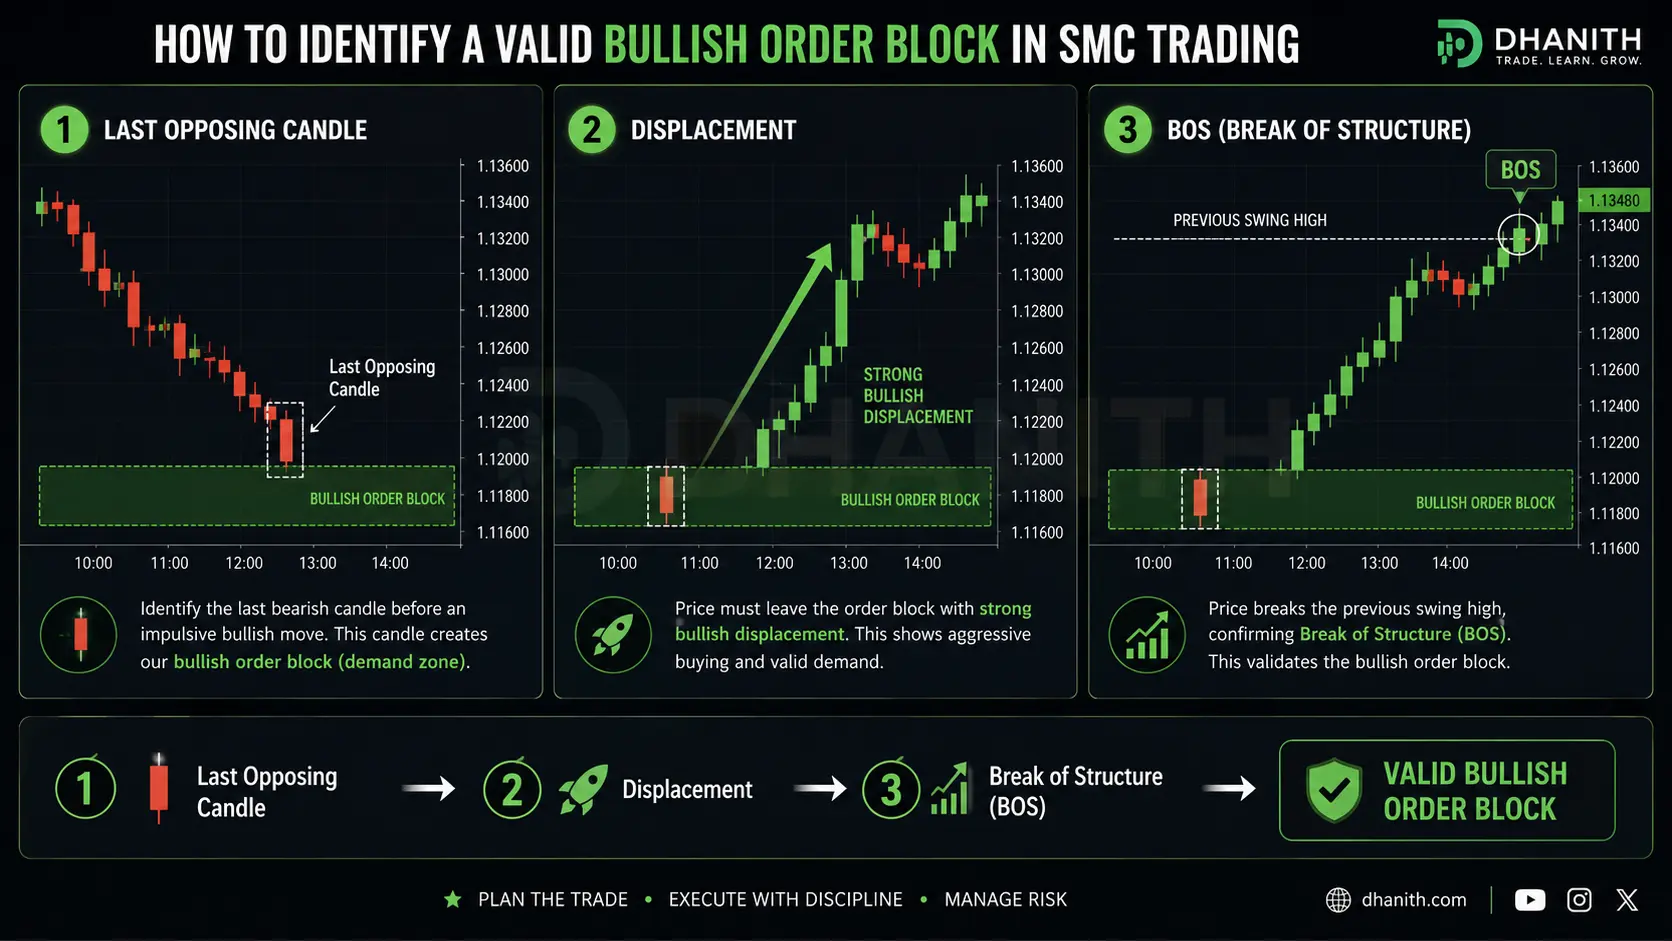
How to Identify a Valid Order Block
Not every candle before a big move is a valid order block. Three conditions must all be met:
Condition 1 — Last opposing candle: For a bullish OB, it must be the last bearish candle before the bullish impulse. For a bearish OB, it must be the last bullish candle before the bearish impulse. Picking any candle in the vicinity is not good enough.
Condition 2 — Displacement: The move away from the OB must be strong and impulsive — characterized by large candles, minimal overlap, and clear directional intent. A slow, grinding move does not qualify.
Condition 3 — Break of Structure: The impulse from the OB must break a meaningful swing point. If price moved strongly but didn't break structure, the zone lacks institutional significance.
If any of these three conditions are missing, it is not a valid order block. Period.
Bullish vs. Bearish Order Blocks
Bullish Order Block:
- The last bearish (red) candle before a strong bullish impulse that breaks a swing high
- When price returns to this zone, expect buying pressure
- Entry: limit order at the 50% level of the OB candle, stop below the OB low, target the next liquidity pool
Bearish Order Block:
- The last bullish (green) candle before a strong bearish impulse that breaks a swing low
- When price returns to this zone, expect selling pressure
- Entry: limit order at the 50% level of the OB candle, stop above the OB high, target the next sell-side liquidity
Mitigated vs. Unmitigated Order Blocks
An unmitigated order block is one that price has not yet returned to. These carry full institutional interest — the orders that initiated the original move are still waiting.
A mitigated order block has already been tested. The institutional orders there have largely been filled. A second return to a mitigated OB carries significantly lower probability than the first.
The rule: Only trade unmitigated order blocks. Once an OB has been tested and price has moved away, mark it as mitigated and remove it from consideration.
Breaker Blocks — When Order Blocks Flip
A breaker block is a former order block that has been invalidated — price passed through it rather than reversing — and now acts as the opposite type of zone.
A bullish OB that price broke through becomes a bearish breaker block. When price retraces back up to this zone, it often acts as resistance rather than support.
This flip of polarity makes intuitive sense: the institutional orders at that level were filled (or stopped out), and the zone now attracts opposing institutional interest.
Part 5: Fair Value Gaps — The Imbalance That Must Be Filled
Fair value gaps are the most objectively identifiable concept in SMC — and among the most consistently profitable when traded correctly.
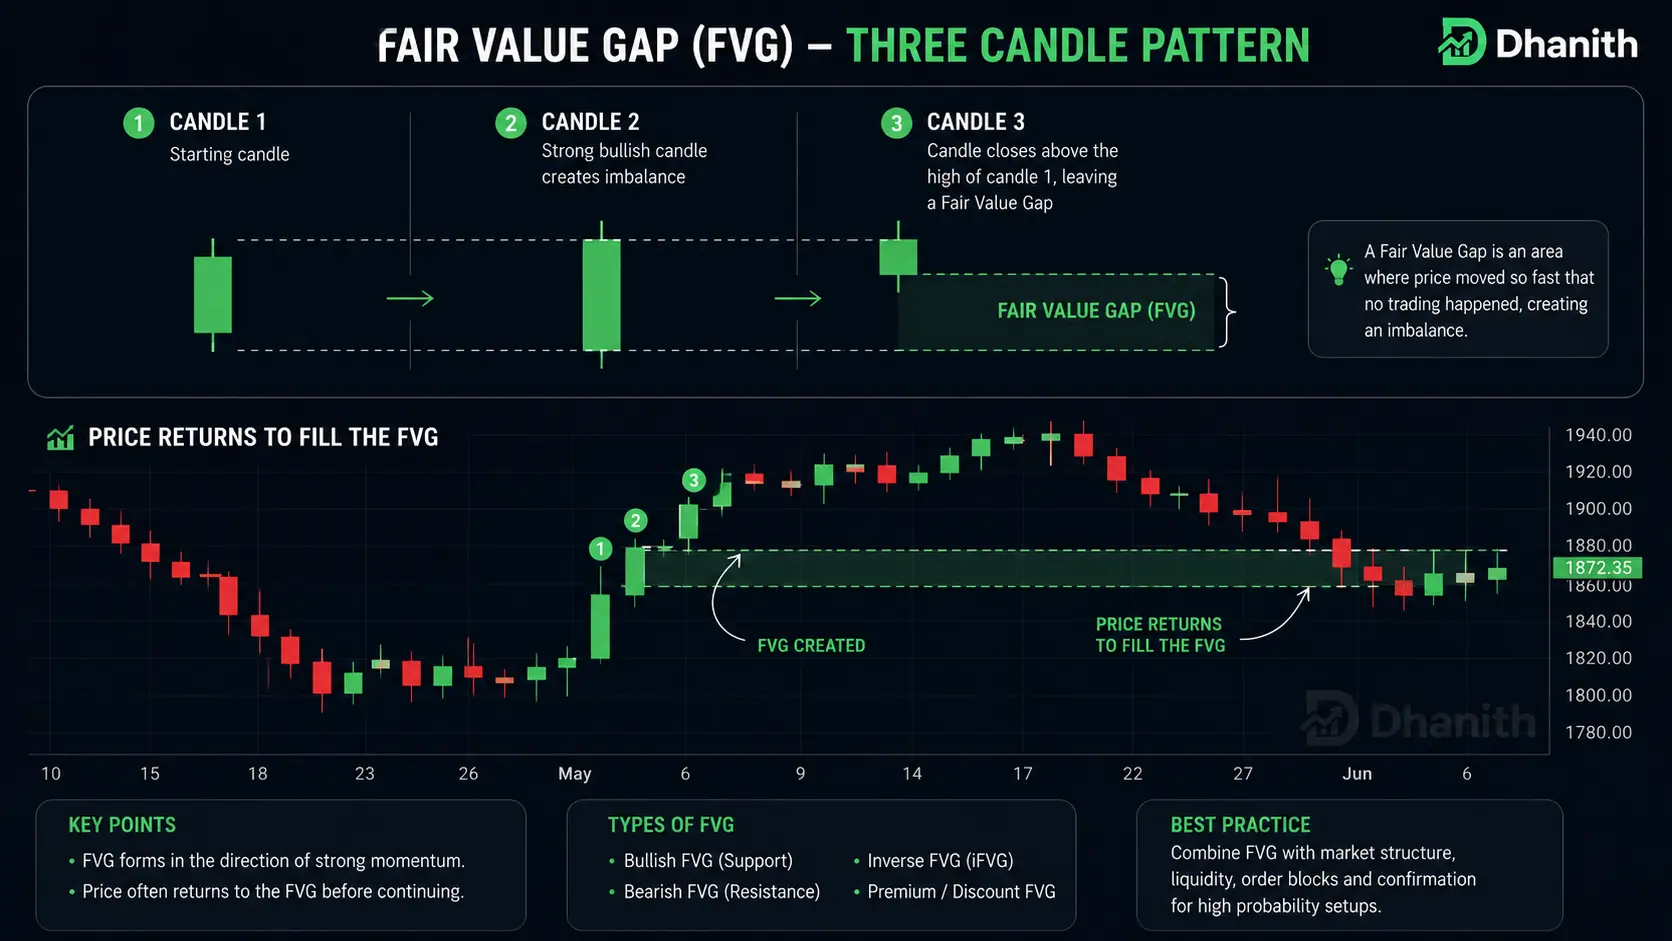
What Is a Fair Value Gap?
A Fair Value Gap (FVG) is a three-candle pattern created when an aggressive, one-sided institutional move leaves a price "gap" — an area that was skipped over entirely because the move was too fast for normal two-sided trading to occur.
The technical definition: A bullish FVG exists when the low of candle 3 is higher than the high of candle 1, leaving an untouched gap in the middle (candle 2). A bearish FVG exists when the high of candle 3 is lower than the low of candle 1.
The key: candle 1's wick and candle 3's wick do not overlap. That non-overlapping space is the fair value gap.
Why Do FVGs Fill?
Markets operate on the principle of continuous two-sided price discovery. When price moves so aggressively that an area is skipped, the market is described as "inefficient" at that level — there was no genuine auction process to determine fair value.
Institutions with remaining orders at those levels, and algorithmic systems designed to seek price efficiency, pull price back to fill these gaps. Research and backtesting consistently show that approximately 70% of fair value gaps are filled — making them one of the highest-probability patterns in SMC trading.
Bullish vs. Bearish FVGs
Bullish FVG: Created during a strong upward move. When price returns to this gap from above, it acts as support. Institutions buy within the gap. This is a high-probability long entry zone.
Bearish FVG: Created during a strong downward move. When price returns to this gap from below, it acts as resistance. Institutions sell within the gap. This is a high-probability short entry zone.
The FVG + Order Block Confluence Zone
The highest-probability SMC setup exists when a fair value gap overlaps with an order block. This creates a combined institutional zone that carries the weight of both concepts:
- The OB confirms institutional orders are present at that level
- The FVG confirms price was delivered inefficiently and must return
- Together, they create a magnetic zone that price is compelled to visit — and where institutional reaction is most likely
When you find this overlap, treat it as a premium zone. This is where the best entries exist in the SMC framework.
Pro Tip: Not all FVGs are equal. An FVG on the daily chart carries far more institutional significance than one on the 5-minute chart. Always prioritize higher timeframe FVGs, using lower timeframe FVGs only for precise entry timing within a higher timeframe setup.
Inverse Fair Value Gaps
An Inverse Fair Value Gap (IFVG) occurs when price fills an FVG but then continues through it, causing the zone to flip polarity. A bullish FVG that was filled and broken through becomes a bearish IFVG — it now acts as resistance rather than support. The logic mirrors breaker blocks: once the original institutional interest is consumed, the zone reverses character.
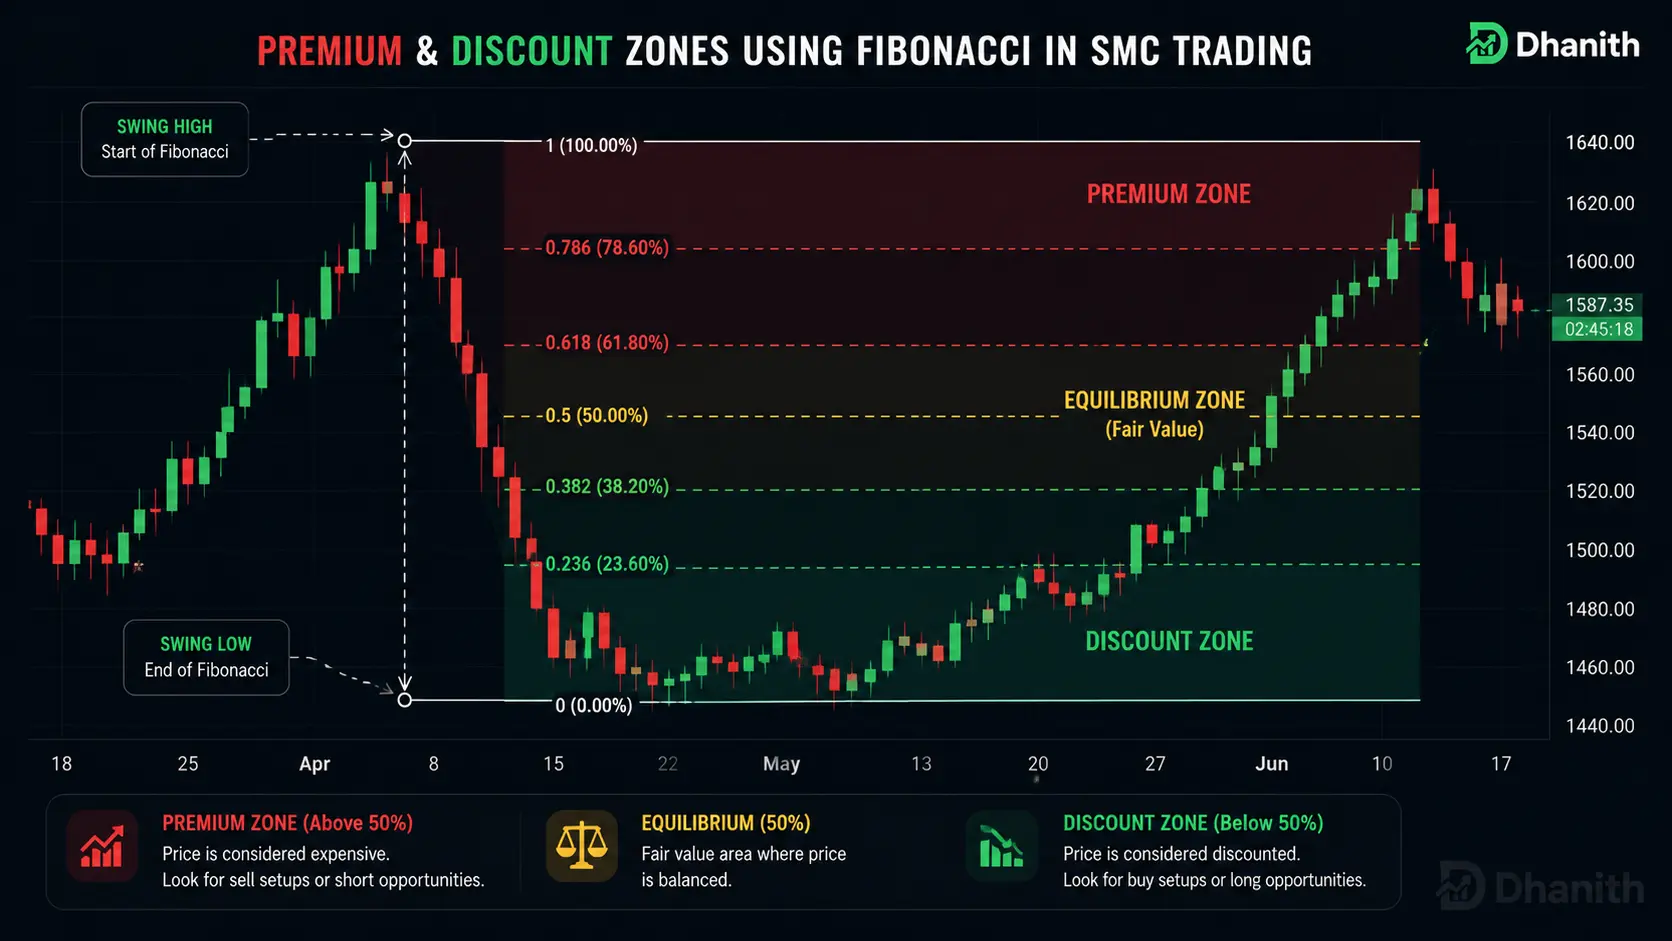
Part 6: Premium and Discount Zones — Where to Buy and Sell
One of the most practically useful concepts in SMC — and one that beginners most frequently ignore — is the premium and discount framework. It answers a simple but crucial question: even if I've identified the right direction, am I entering at a good price?
The Equilibrium Principle
Every price range — whether it's a swing from a recent low to a recent high, or a larger macro range — has a midpoint called equilibrium (EQ). This midpoint is calculated by taking the 50% level of the range using a Fibonacci tool:
- Draw from the range low to the range high
- The 0.5 level (50%) is equilibrium
Above equilibrium = Premium. Price is expensive relative to the range. This is where institutions sell.
Below equilibrium = Discount. Price is cheap relative to the range. This is where institutions buy.
The rule is elegant and powerful: only buy in discount, only sell in premium. A technically perfect bullish order block that sits in the premium zone carries significantly lower probability than one sitting in the discount zone.
This single filter eliminates a large percentage of losing trades that have the right direction but the wrong price.
Applying Premium/Discount to Trades
Step 1: Identify the current swing range (from the most recent significant low to the most recent significant high, or vice versa)
Step 2: Draw a Fibonacci retracement tool across that range
Step 3: The 50% level is equilibrium. Anything below is discount (seek longs). Anything above is premium (seek shorts).
Step 4: When price is in discount and pulling back toward a bullish order block or FVG in that discount zone — that is your setup. When price is in premium and rallying toward a bearish order block or FVG in that premium zone — that is your short setup.
Warning: The most common SMC mistake — confirmed by backtesting data — is entering longs in premium or shorts in discount. Traders find a valid order block, get excited, and enter without checking where they are in the range. The result: a technically correct setup in the wrong price zone, producing consistently losing trades.
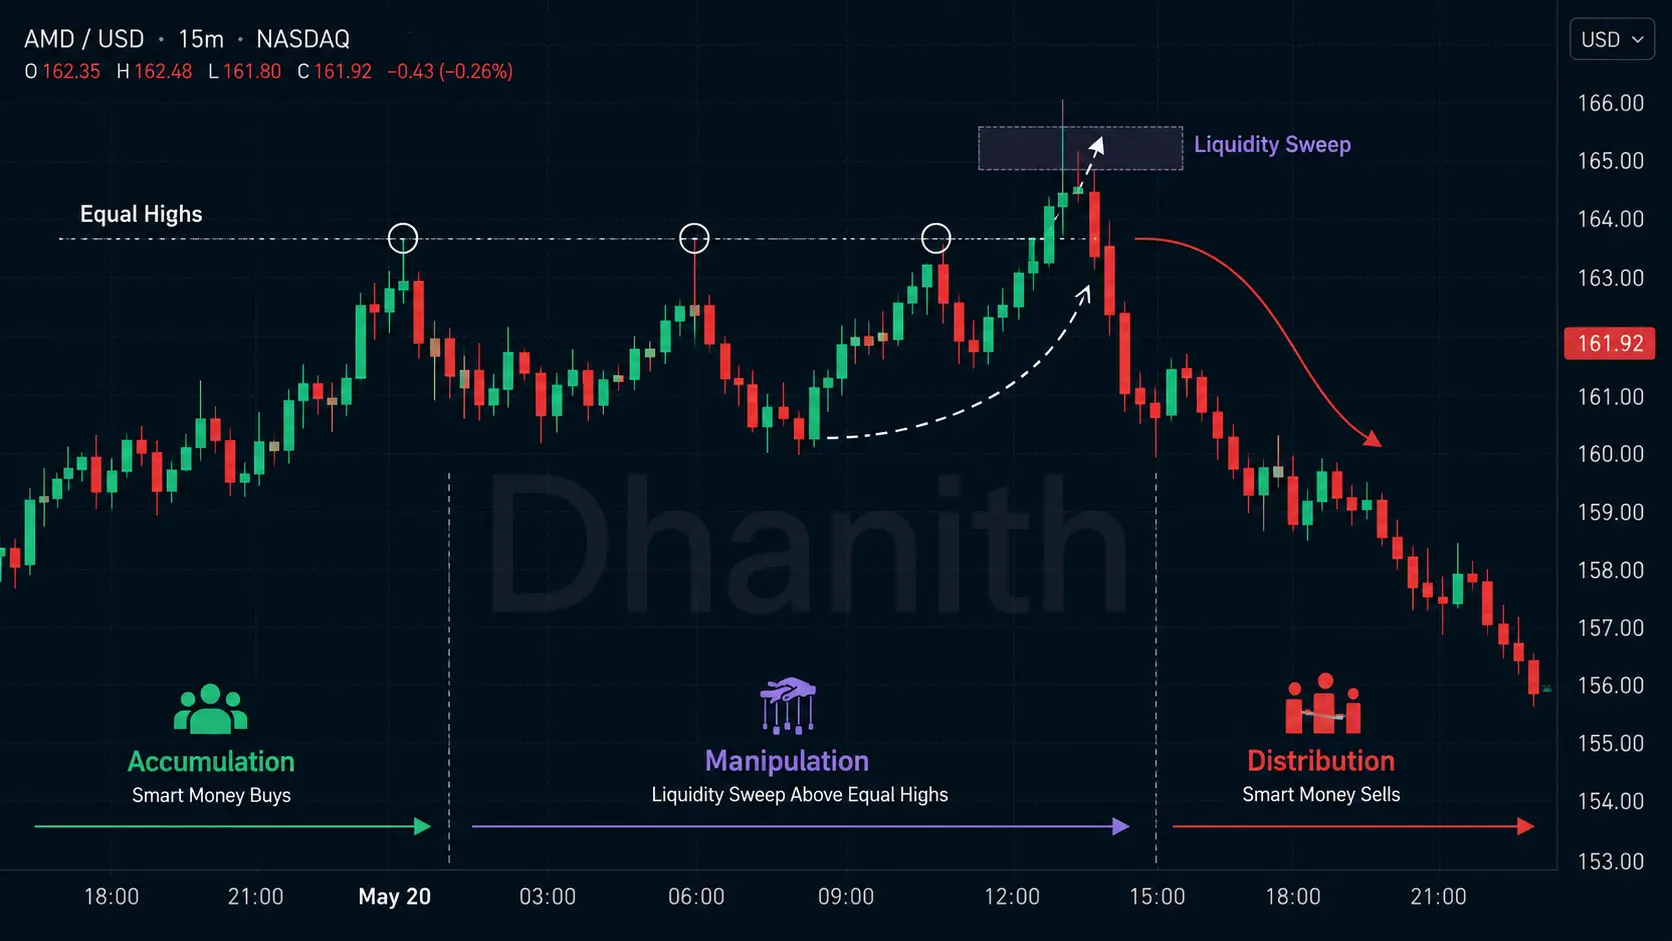
Part 7: The Power of 3 (AMD) — How Institutions Move Price Daily
The Power of 3, also called the AMD cycle (Accumulation, Manipulation, Distribution), describes how institutional price delivery unfolds across a typical trading day. Understanding this cycle transforms how you read intraday price action.
The Three Phases
Phase 1 — Accumulation (Asia Session): The Asian trading session typically builds a defined range with low volatility and low volume. Institutions are quietly accumulating positions, absorbing orders without revealing their directional intent. On a chart, this phase looks like tight, sideways, overlapping candles — boring and range-bound.
Phase 2 — Manipulation (London Open / Early Session): As London opens, institutions engineer a false move — typically in the opposite direction of the real intended move. This is the liquidity grab phase. Price spikes below the Asian range (collecting sell-side liquidity and stopping out early longs) before the real move begins. Or it spikes above the range (collecting buy-side liquidity and stopping shorts) before driving lower.
This is the phase that stops out retail traders who entered during the Asian range. The move looks like a breakout. It isn't.
Phase 3 — Distribution (New York Session): After collecting the necessary liquidity in the manipulation phase, institutions drive price in their intended direction during the New York session. This is the real move. It's typically the most impulsive and sustained of the three phases. Traders who waited through the manipulation phase and entered after the reversal ride this entire move.
Killzones — When Institutions Are Active
Killzones are specific time windows when institutional activity is highest and SMC setups carry the most probability. Trading outside killzones dramatically increases the frequency of false signals.
| Killzone | Time (New York / ET) | Character |
|---|---|---|
| London Open Killzone | 2:00 AM–5:00 AM ET | Highest volatility; major manipulation and direction setting |
| New York AM Killzone | 8:30 AM–11:00 AM ET | Primary trending session; highest volume for US stocks |
| New York Lunch | 11:30 AM–1:00 PM ET | Reduced activity; lower probability setups |
| New York PM Killzone | 1:30 PM–4:00 PM ET | Secondary session; often continues or reverses the AM move |
For stock traders specifically: The New York AM killzone (8:30–11:00 AM ET) is the highest-probability window for SMC setups. Volume is highest, institutional participation is greatest, and the AMD cycle completes most cleanly during this window.
Pro Tip: Most professional SMC traders confine their active trading to the first 90 minutes of the New York session (9:30–11:00 AM ET for US stocks) and use the rest of the day for analysis and preparation. This discipline — trading one hour and walking away — eliminates the low-probability trades that erode accounts during low-volume periods.
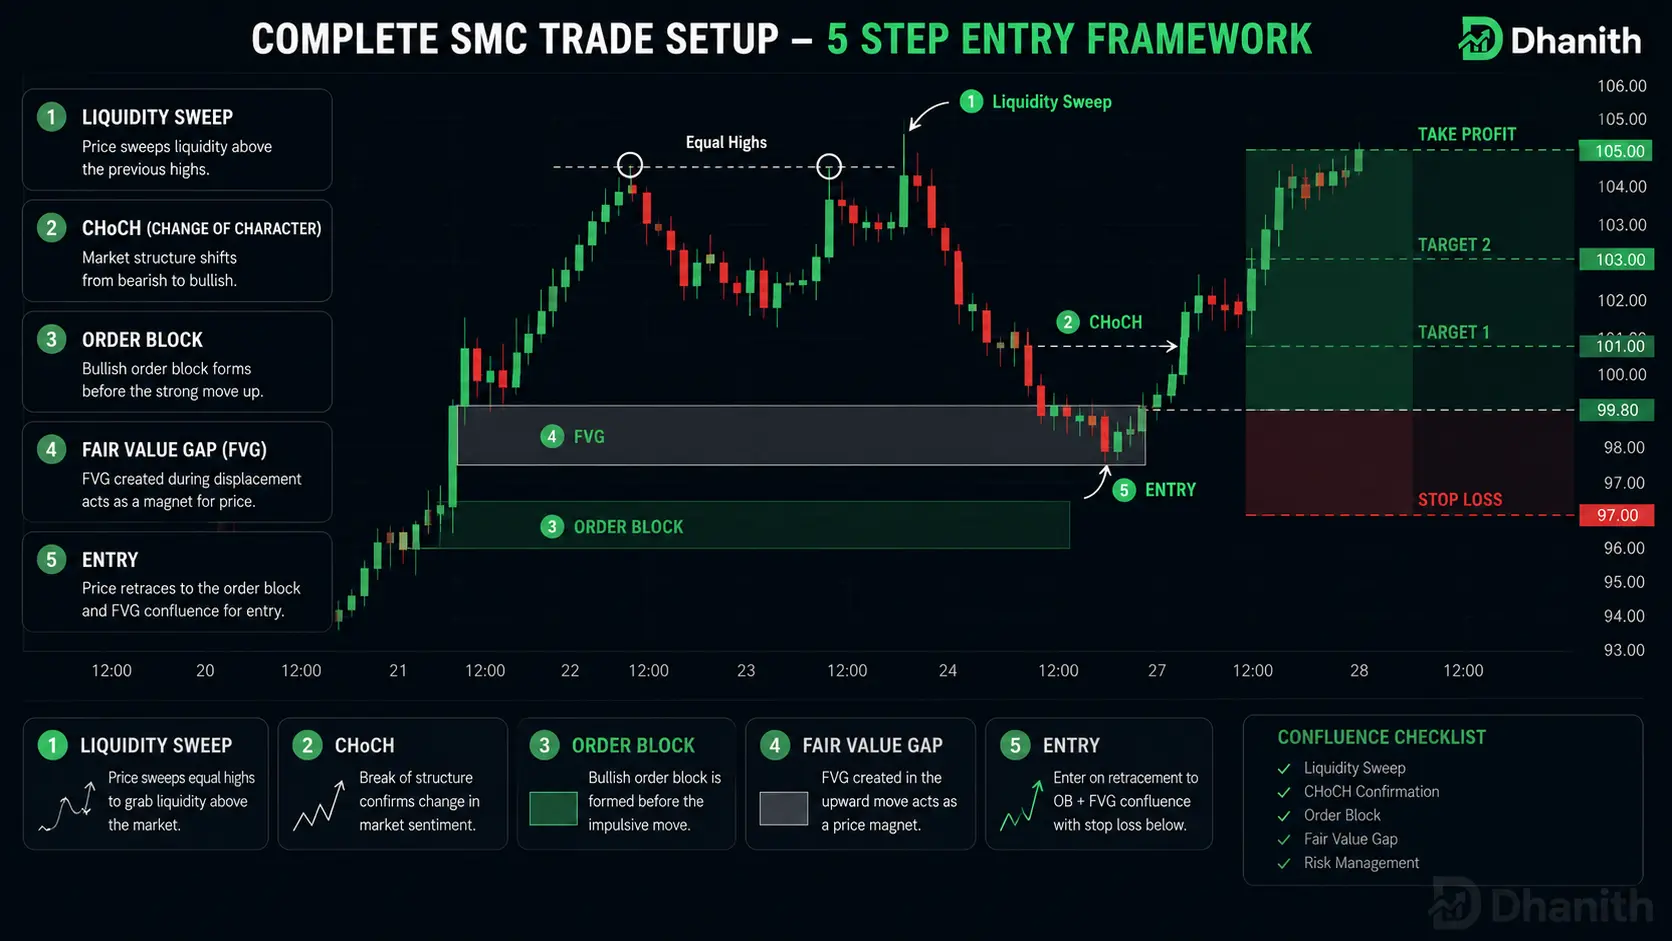
Part 8: The Complete SMC Trade Setup — Step by Step
All of the concepts above exist to serve a single purpose: finding and executing high-probability trades. This is the 5-step framework that brings everything together.
Step 1 — Establish Higher Timeframe Bias (Daily/Weekly Chart)
Before touching a lower timeframe, determine the macro direction.
- Is the daily structure bullish (HH/HL) or bearish (LH/LL)?
- Has there been a recent BOS or CHoCH?
- Is price in a premium or discount zone relative to the weekly range?
- Where is the nearest significant liquidity pool on the daily chart?
Your answers determine your directional bias for all lower timeframe work. If the daily is bullish and price is in discount, you are only looking for long setups on lower timeframes.
Step 2 — Identify the Nearest Liquidity Pool
On the daily chart, mark where the most significant liquidity sits. These are your targets — and often the magnet pulling price before a meaningful reversal.
- Equal highs or lows on the daily
- Previous significant swing points
- Round numbers near current price
- Prior weekly high or low
In a bullish bias, the nearest buy-side liquidity (above swing highs) is your ultimate target. In a bearish bias, the nearest sell-side liquidity (below swing lows) is your target.
Step 3 — Mark Your Key Zones on the 4-Hour Chart
Drop to the 4-hour chart and identify the institutional zones in the direction of your bias:
- Unmitigated order blocks — mark only those that meet all three criteria (last opposing candle, displacement, BOS)
- Fair value gaps — mark unfilled FVGs in the direction of the higher timeframe trend
- OB + FVG confluence zones — mark these separately as premium setups
In a bullish bias, you are marking bullish OBs and bullish FVGs in the discount zone. These are the locations you will watch for price to return to.
Step 4 — Wait for Price to Reach Your Zone
Do nothing until price comes to your level. This is the hardest part of SMC — the patience required to let the market come to you rather than chasing entries.
When price approaches your marked zone, switch to a lower timeframe (15-minute or 5-minute chart) and watch for:
Liquidity sweep: Does price briefly exceed the obvious level before reversing? A sweep of sell-side liquidity just before entering a bullish OB is an extremely strong confirmation.
CHoCH on the lower timeframe: After price enters your zone, does the 15-minute chart show a change of character — breaking a Lower High and creating the first Higher High? This is your confirmation that the zone is being respected.
Step 5 — Execute the Trade with Defined Risk
Entry: After the CHoCH confirmation on the lower timeframe, enter at market or use a limit order at the 50% level of the OB or at the midpoint of the FVG.
Stop Loss: Place your stop below the lowest point of the liquidity sweep (for longs) or above the highest point (for shorts). This places your stop in a location that, if reached, confirms your analysis was wrong — not just that the market ran stops.
Target: The nearest opposing liquidity pool. In a bullish trade, this is the nearest buy-side liquidity (swing high, equal highs). Minimum reward-to-risk ratio: 2:1. Do not take setups with less than 2:1.
Trade Management: Once price reaches 50% of the distance to your target, move your stop to breakeven. Let the remaining position run to target. Do not move targets mid-trade without structural reason.
Part 9: SMC and the Wyckoff Method — The Combined Framework
Smart Money Concepts does not exist in isolation. Its deepest roots connect directly to Richard Wyckoff's institutional analysis framework, developed in the 1930s. Understanding this connection provides macro context that enhances every SMC trade.
The Four Wyckoff Phases
1. Accumulation: Institutions quietly build long positions within a defined trading range. Price moves sideways with decreasing downside momentum. Volume is high on upswings and low on downswings within the range. This phase ends with a "spring" — a brief dip below the range's support that sweeps sell-side liquidity before the markup begins.
2. Markup: After accumulation, institutions drive price upward in a sustained trend. Pullbacks are shallow and brief — smart money is not selling; they're adding to long positions.
3. Distribution: At significantly higher prices, institutions begin offloading their accumulated positions to retail traders who believe the uptrend will continue. The chart shows a new trading range at elevated prices, with subtle signs of supply overcoming demand.
4. Markdown: After distribution is complete, price declines. Institutions are now positioned short, and the decline mirrors the markup phase in the opposite direction.
The SMC translation:
- Wyckoff Spring = SMC sell-side liquidity sweep
- Wyckoff UTAD (Upthrust After Distribution) = SMC buy-side liquidity sweep at distribution
- Wyckoff Sign of Weakness = SMC bearish CHoCH
- Wyckoff Sign of Strength = SMC bullish BOS after accumulation
Using Wyckoff for the macro cycle and SMC for precise entry timing creates the most complete institutional trading framework available to retail traders.
Part 10: Common SMC Mistakes and How to Avoid Them
Knowing SMC concepts intellectually and applying them profitably are two very different things. These are the five mistakes that destroy SMC trading accounts, in order of frequency.
Mistake 1 — Marking Invalid Order Blocks
The most common error: marking any candle before a big move as an order block without verifying all three conditions. Invalid OBs produce consistent losses because there's no genuine institutional interest at those zones.
The fix: Before marking any OB, run through the checklist: (1) Is it the last opposing candle? (2) Was the departure displacement? (3) Did it cause a BOS? If any answer is no — do not mark it.
Mistake 2 — Ignoring Higher Timeframe Bias
Finding a beautiful bullish setup on the 15-minute chart without checking that the daily is in a bearish downtrend. A bullish OB on the 15-minute chart within a daily bearish structure has dramatically lower win rate than the same pattern in a bullish daily trend.
The fix: The daily chart determines direction. Always. No exceptions. If you can't identify a clear daily bias, you don't trade that day.
Mistake 3 — Trading Outside Killzones
SMC setups that form during the lunch lull (11:30 AM–1:00 PM ET) or in the Asian session for US stocks have significantly more false positives because institutional participation is minimal. The patterns appear valid but lack the institutional follow-through that makes them work.
The fix: Restrict active trading to the New York AM killzone (9:30–11:00 AM ET) for US stocks. Use other times for analysis and preparation only.
Mistake 4 — Entering in the Wrong Premium/Discount Zone
Traders find a valid bullish order block, enter immediately — without checking that the OB sits in the premium zone (above the 50% level of the range). The result is a technically correct OB in the wrong price area, producing consistent losing trades.
The fix: Before every trade entry, draw the Fibonacci tool over the current swing range. Verify the OB or FVG sits in discount (for longs) or premium (for shorts). If it doesn't — wait for a better setup.
Mistake 5 — Entering on the First Structure Break (Before Inducement Resolves)
The first break of structure after a consolidation is frequently inducement — a trap designed to stop out traders before the real move. Entering on the first BOS without waiting for the liquidity sweep to complete results in getting trapped in the wrong direction repeatedly.
The fix: After a first structure break, wait. Watch for price to sweep the obvious liquidity level. After the sweep, look for CHoCH confirmation on the lower timeframe. That confirmed post-sweep CHoCH is the real entry.
Part 11: Building Your SMC Trading Routine
Knowledge without process produces inconsistency. Here's a daily routine that puts all of the above into a repeatable framework.
Pre-Market (Before 9:00 AM ET)
Weekly chart review (5 minutes): Identify the macro trend, significant liquidity pools, and any major OBs or FVGs that have been sitting unmitigated for multiple weeks.
Daily chart analysis (10 minutes): Determine today's bias. Has yesterday's close maintained the structure? Mark the day's key zones: unmitigated OBs, unfilled FVGs, and the nearest liquidity pools above and below current price.
4-Hour chart markup (10 minutes): Within the daily bias, mark the 4H institutional zones you'll be watching for reactions. Note whether price is currently in premium or discount.
Watchlist preparation: Identify 3–5 stocks where the daily structure is clear and the nearest institutional zone is within reach during today's session.
During the Session (9:30–11:30 AM ET)
9:30–10:00 AM: Watch the open. The first 30 minutes often contains the manipulation phase of the daily AMD cycle. Do not enter in the first 5–10 minutes. Watch for the sweep of the most obvious liquidity level.
10:00–11:00 AM: This is your primary entry window. After the AM manipulation resolves, price typically begins the distribution phase. Look for your pre-marked zones to be tested, the liquidity sweep to confirm, and the CHoCH on the 15-minute chart.
11:00–11:30 AM: If you're in a trade, manage it according to your predetermined plan. If no valid setup appeared, today is a no-trade day. Accept it.
End of Day (After 4:00 PM ET)
Trade journal entry: Record every trade with: the setup type, timeframe, entry rationale, what worked, what didn't, and what you would do differently. This is non-negotiable. The journal is where improvement happens.
Chart review: Review today's price action against your pre-market analysis. Did the AMD cycle play out as expected? Were your zones respected? This continuous feedback loop is how SMC pattern recognition becomes intuitive over time.
FAQ
Q: What is the difference between SMC and ICT? ICT (Inner Circle Trader) is the foundational methodology developed by Michael J. Huddleston, from which SMC evolved. The core concepts are nearly identical — order blocks, fair value gaps, liquidity, killzones, and market structure. SMC refers to the broader community-evolved version of these teachings, with some standardized terminology differences. For practical trading purposes, the two frameworks are interchangeable.
Q: Can Smart Money Concepts be used for stock trading, or is it only for forex? SMC applies to any liquid market with institutional participation — stocks, forex, crypto, futures, and commodities. For US stocks, the framework works particularly well during the New York AM killzone (9:30–11:00 AM ET) when institutional volume is highest. The same concepts of order blocks, fair value gaps, and liquidity sweeps appear on stock charts just as they do on forex charts.
Q: How long does it take to become proficient at SMC trading? Most traders need 6–12 months of consistent chart study combined with real or demo trading to develop reliable pattern recognition. Full proficiency — where the analysis feels intuitive and execution is consistent — typically requires 1–2 years of disciplined practice, journaling, and continuous refinement.
Q: Is SMC better than traditional technical analysis? SMC doesn't replace traditional technical analysis — it explains it. What traditional TA calls "support and resistance" is often an order block. What it calls a "false breakout" is usually a liquidity sweep. SMC provides the institutional reasoning behind the patterns that traditional TA identifies visually. Used together, they create a more complete picture than either approach alone.
Q: What is the best timeframe for SMC trading in stocks? Use the weekly and daily charts to establish bias and identify macro zones. Use the 4-hour chart to mark institutional zones. Use the 15-minute or 5-minute chart for entry confirmation (CHoCH after liquidity sweep). This top-down, multi-timeframe approach is the standard SMC method for intermediate and advanced traders.
Q: What tools do I need to trade SMC effectively? TradingView is the most widely used charting platform for SMC analysis — it has all the drawing tools needed for marking OBs, FVGs, and liquidity levels. The basic free tier is sufficient to start. For US stocks specifically, thinkorswim (TD Ameritrade/Schwab) offers excellent charting combined with direct stock execution. No special indicators are required — SMC is a pure price action methodology.
Conclusion
Smart Money Concepts fundamentally changes the way you read a price chart.
The random-looking wicks that used to stop you out are liquidity sweeps — institutional order collection. The support level that "broke for no reason" was an inducement. The gap that formed during a big move was a fair value gap — a zone price is magnetically drawn to return to. None of it was random. All of it was engineered.
The three most important things to take from this guide:
-
Market structure is everything. Before any other analysis — daily bias, BOS vs. CHoCH, premium vs. discount. Structure first, always.
-
Liquidity is the engine. Every significant price move begins with a liquidity sweep. Learn to wait for it instead of being its victim.
-
Confluence is your edge. A liquidity sweep, at an unmitigated order block, overlapping a fair value gap, in the discount zone, during the NY AM killzone — that is a setup worth trading. Two or three of those factors is interesting. All five is exceptional.
SMC does not guarantee profits. No methodology does. What it gives you is a framework grounded in how markets actually work — not in lagging indicators or pattern memorization. When combined with strict risk management and consistent execution, it provides a genuine, sustainable edge.
Start with market structure. Master it completely before moving to the next concept. Build your understanding one layer at a time, in the order this guide presents it. The traders who fail at SMC are those who skip to order blocks and fair value gaps without first understanding why liquidity moves markets. The traders who succeed build the foundation first.
The market will never look random again.
Related Articles
- SMC Market Structure: BOS, CHoCH and Strong vs Weak Levels — Deep dive into the structural foundation of SMC: how to read trend states, identify valid BOS vs CHoCH, and distinguish strong from weak swing levels
- Order Blocks: The Complete Mastery Guide — Everything you need to identify, grade, and trade institutional order blocks with a 5-point quality system and three entry models
- Fair Value Gaps: The Complete Mastery Guide — How fair value gaps form, why they fill ~70% of the time, and the five FVG strategies from basic to advanced
- Liquidity Sweeps: The Complete Mastery Guide — The mechanics behind stop hunts, how to map liquidity pools, and how to enter after the sweep rather than during it
- Accumulation, Manipulation, Distribution (AMD Cycle) — How to read the three-phase institutional price cycle that structures every trading day
- SMC Killzones: The Complete Trading Guide — Why institutional setups only work during specific time windows and how to confine your trading to the highest-probability hours
Disclaimer: This article is for educational purposes only and does not constitute financial or investment advice. Trading stocks involves significant risk of loss. Past performance of any strategy or methodology does not guarantee future results. Always trade with proper risk management and capital you can afford to lose.
Continue Reading

