
Accumulation, Manipulation, Distribution (AMD): The Complete ICT Trading Guide (2026)
Master the AMD cycle in trading. Learn accumulation, manipulation (Judas Swing), and distribution phases — with session timing, multi-timeframe application, candle anatomy, and step-by-step stock trading strategies for 2026.
Introduction
Every morning, millions of retail traders watch the market open and try to determine: which way is it going today?
They look at indicators. They check the news. And when the market opens, many of them enter trades based on the first candle's direction — only to get reversed within minutes, stopped out, and left watching the real move happen without them.
That first move — the one that traps them — was not a mistake or a random event. It was Phase 2 of a three-phase institutional process that has been repeating, every single day, on every liquid market, across every timeframe.
The process is called Accumulation, Manipulation, Distribution — AMD. And understanding it changes how you experience the market at a fundamental level.
Instead of reacting to every candle and chasing every move, you begin to recognize the three distinct phases that institutions cycle through before any sustained directional move begins. You stop trading the manipulation (the trap) and start positioning for the distribution (the real move).
TL;DR — Key Takeaways
- AMD (Accumulation, Manipulation, Distribution) describes how every institutional price cycle unfolds in three phases — from position building through the false move to the real directional delivery
- Phase 1 (Accumulation): Tight, boring range — institutions quietly building positions
- Phase 2 (Manipulation / Judas Swing): Sharp false move in the opposite direction — triggers retail stops and breakout traders
- Phase 3 (Distribution): The real institutional move — sustained, directional, and fueled by the liquidity collected in Phase 2
- AMD is fractal: it appears in the daily candle (Asian = accumulate, London = manipulate, NY = distribute), weekly candles, monthly candles, and on individual 15-minute structures
- The entry is always in Phase 3 — after the manipulation has confirmed via a lower timeframe CHoCH or MSS
- Never enter during Phase 2 (the manipulation) — that is the trap, not the trade
Part 1: What Is AMD? Origins, Definition, and Core Principle
The Historical Foundation — Wyckoff's Market Cycle
The AMD model's roots go back nearly a century to Richard Wyckoff, who identified in the 1930s that stock markets moved through predictable cycles of institutional accumulation and distribution.
Wyckoff's original framework described four phases: Accumulation, Markup, Distribution, and Markdown. ICT's AMD model takes this foundational framework and applies it at every timeframe — from quarterly macrocycles down to individual intraday sessions — with the specific additions of liquidity sweep mechanics, session timing (killzones), and integration with modern order flow concepts.
The Modern AMD Framework
A — Accumulation: Price consolidates in a defined range. Institutions are quietly building positions. The chart looks boring, indecisive, range-bound. Meanwhile, institutions are loading up on one side.
M — Manipulation (The Judas Swing): Price makes a sharp, aggressive move in the opposite direction of the real institutional intent. This false move triggers retail stop losses and attracts breakout traders who enter in the wrong direction, providing the liquidity institutions needed. Named after the biblical betrayal, the Judas Swing is the most important pattern to recognize.
D — Distribution: The real institutional move. After collecting the liquidity from Phase 2, institutions reverse and drive price in their actual intended direction. This is the sustained, directional delivery. The entry for the retail SMC trader is here — in Phase 3, never in Phase 2.
AMD vs. Power of 3 — Same Concept, Different Name
AMD emphasizes the behavioral description of each phase — what institutions are doing.
Power of 3 (PO3) emphasizes the geometric description on the daily candle — the open, the sweep in one direction (creating the day's high or low), and the close in the other direction (creating the real move).
In a bullish Power of 3 day:
- Open = the reference point (roughly the top of the accumulation range)
- Low of day = the manipulation (price sweeps below the open, taking stops)
- Close near the high = the distribution (real move delivers upward)
Part 2: Phase 1 — Accumulation (The Range)
What Accumulation Looks Like on a Chart
The accumulation phase is characterized by:
- Tight, overlapping candles — price moves sideways without directional conviction
- Shrinking range — each candle's high-to-low range progressively narrows
- Low volatility — ATR is at or below the recent average
- Oscillating price — price bounces between a horizontal ceiling and floor
The Institutional Activity During Accumulation
A large fund that wants to build a $500 million long position cannot simply buy at market. Instead:
- They place limit buy orders at the lower half of the accumulation range
- They allow range oscillation, filling portions of their order on each dip
- They distribute the order across time and multiple price levels to hide the scale of their buying
Recognizing the End of Accumulation
Visual signals that accumulation is completing:
- Range compression: The high-to-low range of each successive candle shrinks noticeably
- Volume declining within the range: Thin volume means fewer counterparties — the available liquidity is being absorbed
- Equal highs and equal lows forming: The range boundaries become increasingly well-defined
- Session/time alignment: The accumulation phase typically aligns with a specific session (the Asian session for intraday traders)
Pro Tip: The most reliable signal that accumulation is complete and Phase 2 is approaching: price has spent enough time in the range that equal highs or equal lows are clearly visible, the range is narrow, and the next high-volume session (London Open or NY Open for stocks) is about to begin.
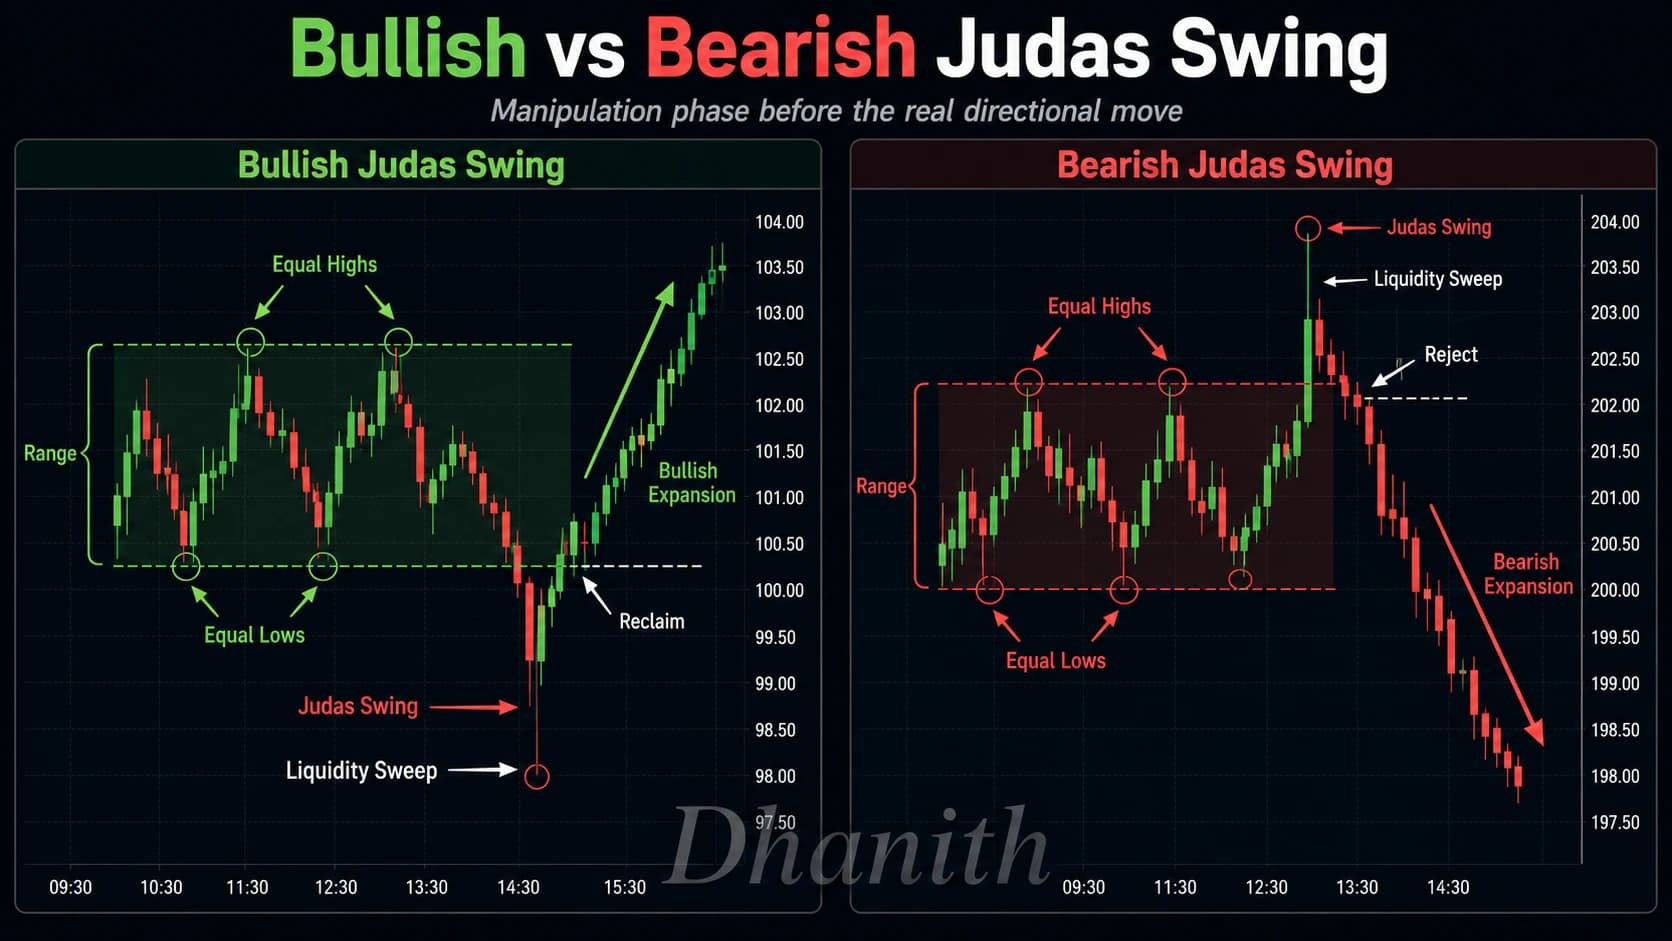
Part 3: Phase 2 — Manipulation (The Judas Swing)
The Judas Swing — Named for a Reason
The manipulation phase is the most important concept in the AMD framework for one simple reason: it is the phase that traps retail traders and the phase that precedes the only move worth trading.
Every single detail of the Judas Swing is designed to convince retail traders that the real move has begun — in the wrong direction. It looks like a breakout. It feels like momentum. It produces FOMO.
The Bullish AMD Day — Complete Sequence
On a bullish AMD day (where the real move is upward):
Phase 1 (Accumulation): Price consolidates near the session open. The Asian session creates a tight range. Institutions are quietly building long positions.
Phase 2 (Manipulation — bearish Judas Swing): At or around the London open, price breaks below the accumulation range's low. This spike downward triggers the stop losses of long traders. Price creates the day's LOW during this phase. The move looks convincingly bearish.
Phase 3 (Distribution — bullish delivery): With sell-side liquidity collected, institutions reverse price aggressively upward. Price breaks above the accumulation range's high, creates a bullish fair value gap, and forms the day's HIGH. The daily candle will close near its high — a bullish candle with a long lower wick (the Judas Swing wick).
The Bearish AMD Day — Complete Sequence
On a bearish AMD day (where the real move is downward):
Phase 2 (Manipulation — bullish Judas Swing): Price breaks above the accumulation range's high. Stop losses of short sellers are triggered. Breakout buyers enter long. Price creates the day's HIGH.
Phase 3 (Distribution — bearish delivery): Institutions reverse price downward aggressively. Price breaks below the accumulation range's low, creates a bearish FVG, and delivers toward the sell-side liquidity target. The daily candle closes near its low.
The Visual Signature of the Judas Swing
- The spike candle: The manipulation candle is notably larger than the surrounding accumulation candles
- The wick or reversal: The manipulation either creates a prominent wick (liquidity grab) or takes 1–3 candles to complete before reversing
- The return: Within minutes to a few candles, price aggressively reverses back through the range
- Volume pattern: Volume spikes during the Judas Swing, then fades as price reverses; volume expands again on the real directional move
Warning: The Judas Swing is specifically engineered to look convincing. The only signal that it's manipulation and not a genuine breakout is the speed of the reversal. If price has not closed back inside the range within 3–5 candles of the spike, reassess — it may be a genuine breakout rather than a manipulation.
Part 4: Phase 3 — Distribution (The Real Move)
What Distribution Looks Like
The distribution phase is characterized by:
- Impulsive, large candles in the direction of the real move — often 2–4x the size of accumulation candles
- Fair value gaps left behind by the displacement
- Break of Structure (BOS) — price breaks a meaningful prior swing high or swing low
- Volume expansion — confirming institutional participation
Entry Mechanics in the Distribution Phase
Step 1 — Confirm the daily bias before the session opens using higher timeframe structure.
Step 2 — Mark the accumulation range. These are your expected Judas Swing targets.
Step 3 — Wait for the Judas Swing. Do not enter during this phase. Watch.
Step 4 — Confirm the reversal (LTF CHoCH/MSS). After the Judas Swing sweep, drop to the 15-minute or 5-minute chart and watch for a Change of Character or Market Structure Shift.
Step 5 — Enter at the distribution's first PD array. The initial distribution displacement creates a fair value gap or order block. Enter at the CE (50% midpoint) of the FVG or at the OB zone.
Stop loss: Below the Judas Swing's swept extreme (for bullish setups).
Target: The next opposing liquidity pool.
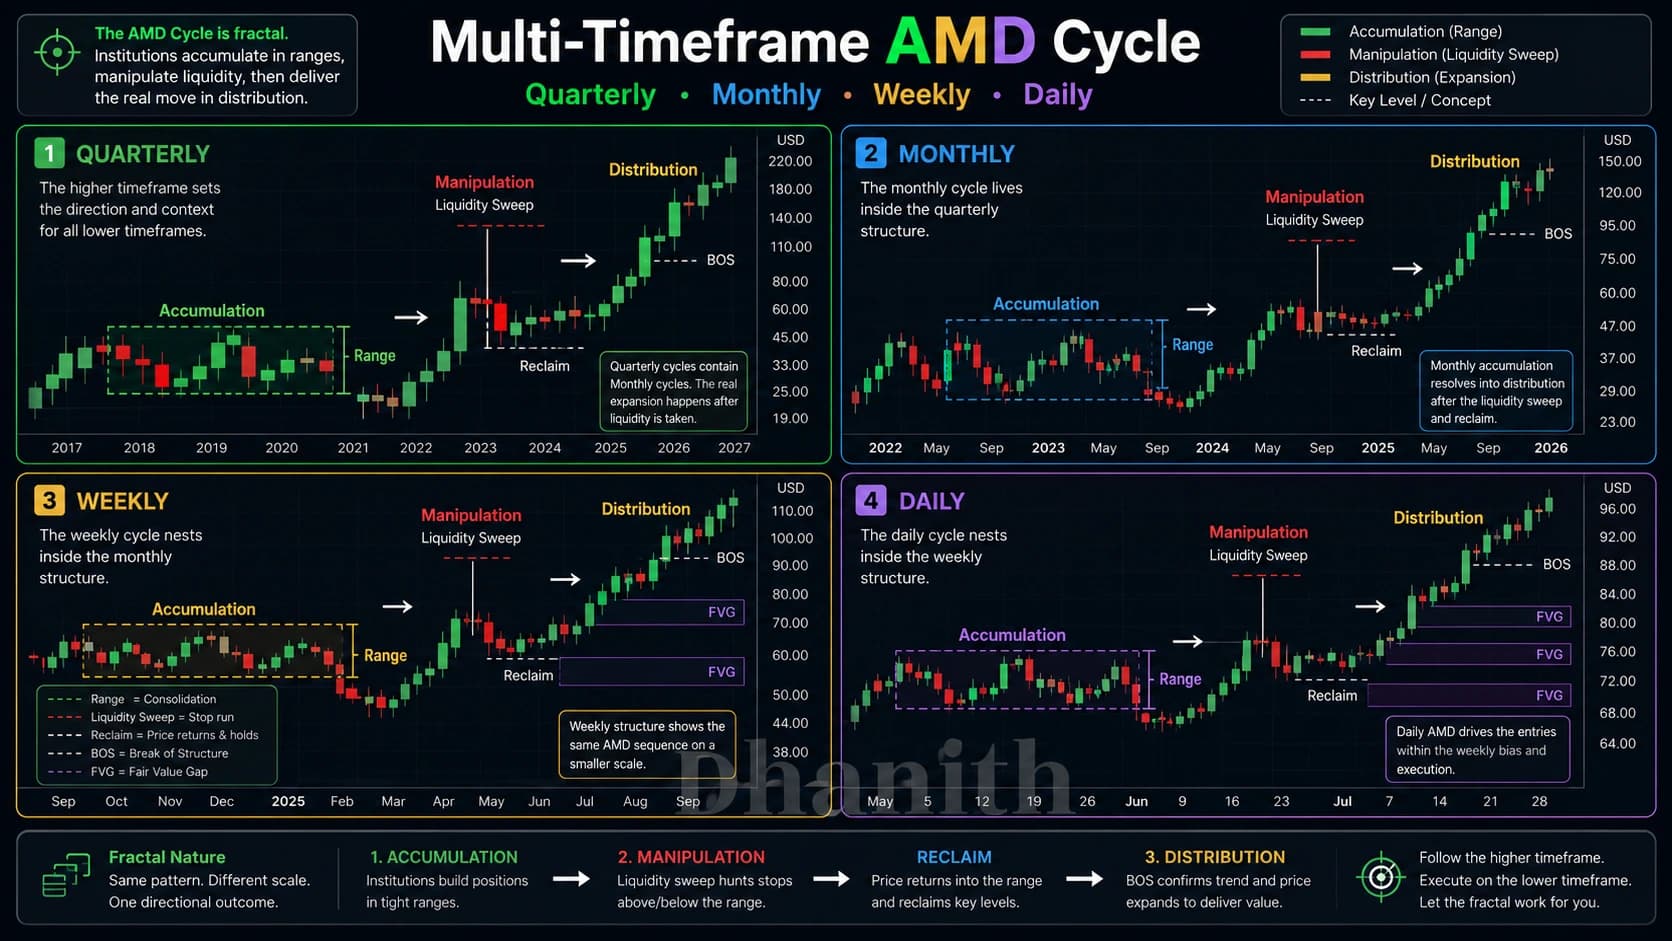
Part 5: AMD Is Fractal — The Multi-Timeframe Cycle
The most powerful insight about AMD is that it is not confined to the daily timeframe. The same three-phase cycle appears at every timeframe, nested inside each other like Russian dolls.
The Daily AMD Cycle (The Primary Trading Cycle)
| Session | Phase | Time (ET for US stocks) | What Happens |
|---|---|---|---|
| Asian Session | Accumulation | 8:00 PM–2:00 AM ET | Tight range; institutions building positions |
| London Open | Manipulation | 2:00 AM–5:00 AM ET | Judas Swing sweeps Asian range |
| NY AM Session | Distribution | 8:30 AM–12:00 PM ET | Real directional move; highest-probability entry window |
| NY Lunch | Consolidation | 12:00 PM–1:30 PM ET | Low-volume pause |
| NY PM Session | Continuation | 1:30 PM–4:00 PM ET | Either distribution continues or retracement |
The Weekly AMD Cycle
- Monday–Tuesday (Accumulation): The week opens with consolidation
- Tuesday–Wednesday (Manipulation): Mid-week Judas Swing — often creates the week's high (bearish weekly) or week's low (bullish weekly)
- Wednesday–Friday (Distribution): The real weekly move
The Quarterly AMD Cycle
- Q1 (Accumulation): January–March — institutions build long-term positions
- Q2 (Manipulation): April–June — a significant false move
- Q3 (Distribution): July–September — the real multi-month directional delivery

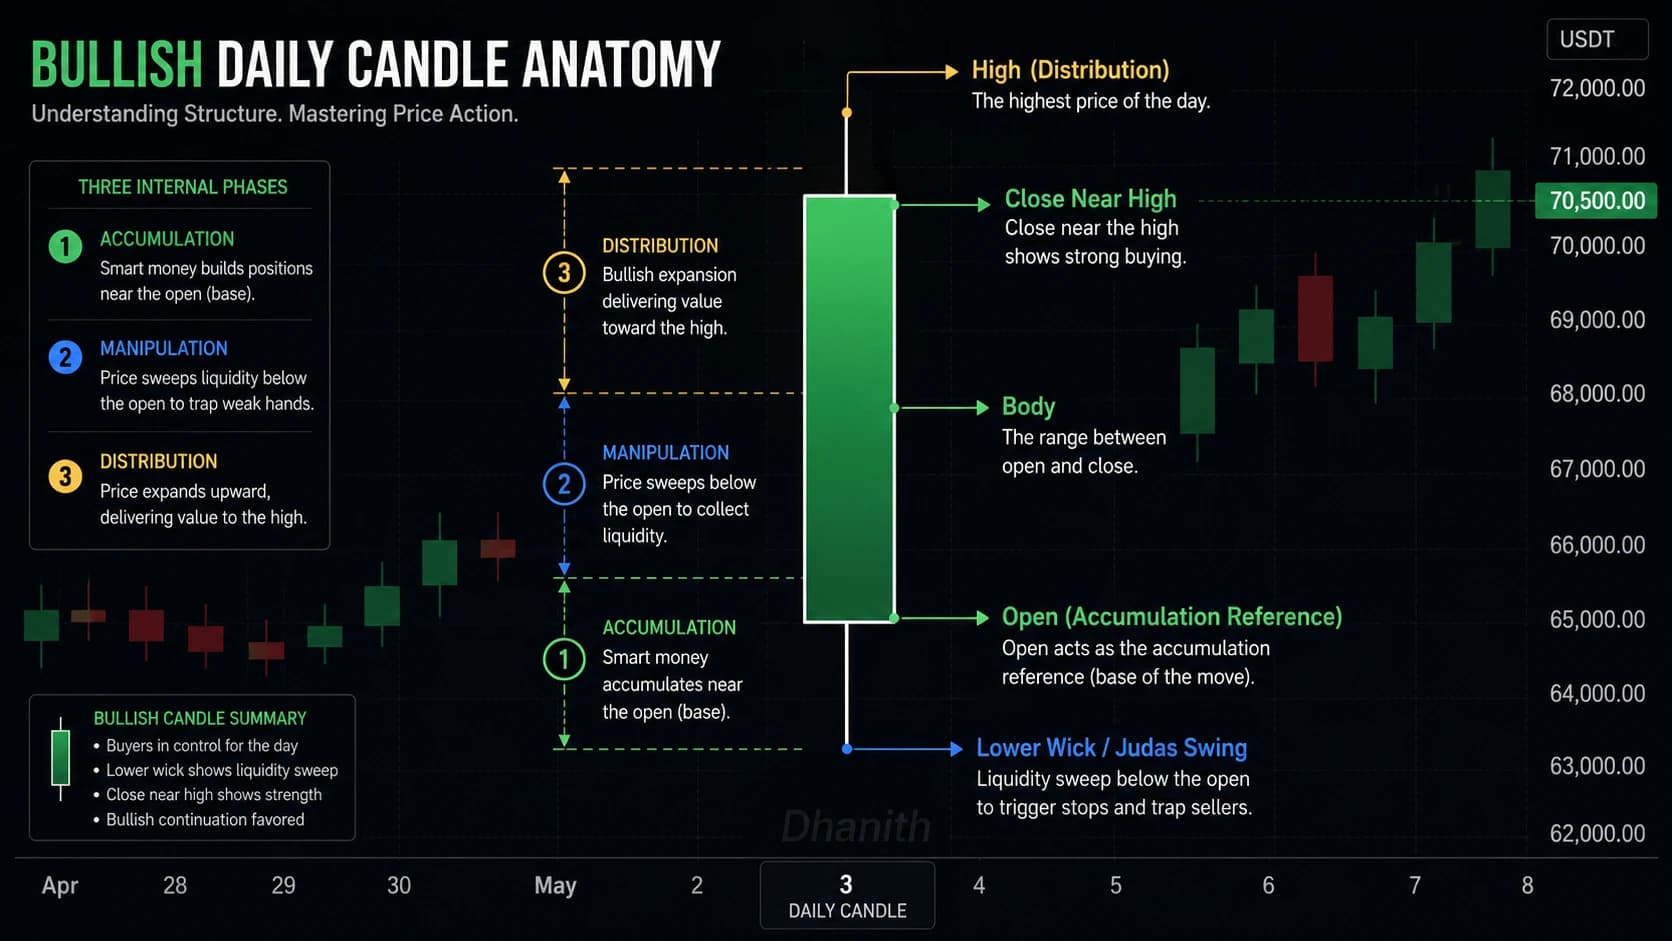
Part 6: AMD and Candle Anatomy — Reading the Daily Candle
Every candle on any timeframe contains its own complete AMD cycle in its internal structure.
How a Daily Candle Forms — The AMD Story
Bullish daily candle anatomy:
- Open = The reference point around which accumulation occurs
- Low = The manipulation point — where the Judas Swing drove price before reversing
- High = Where distribution delivered price
- Close = Near the high — confirming the bullish character of the day's AMD cycle
A daily candle with a long lower wick, small or no upper wick, and a close near the top tells the complete AMD story: accumulation, bearish manipulation (the wick), bullish distribution (the body), confirmed by the close near the high.
Bearish daily candle anatomy:
- Open = Accumulation reference
- High = Manipulation point (the Judas Swing spike creating the long upper wick)
- Low = Distribution target (bearish delivery)
- Close = Near the low
Part 7: AMD in the Complete SMC Framework
AMD and Liquidity Sweeps
Phase 2 of AMD is a liquidity sweep. The Judas Swing is the same institutional stop-hunting mechanism described in the liquidity sweeps framework — AMD gives it temporal structure (when to expect it) rather than just mechanical structure (what it looks like).
Understanding AMD allows you to anticipate liquidity sweeps rather than simply recognize them after the fact.
AMD and Order Blocks
The distribution phase's first displacement candle creates order blocks. The last bearish candle before the initial bullish distribution surge is a valid bullish order block — precisely at the entry point for the distribution phase trade.
OBs created by the initial distribution impulse following the Judas Swing are the highest-quality institutional zones on the chart.
AMD and Fair Value Gaps
The initial distribution displacement is, by definition, impulsive and aggressive. It nearly always leaves a fair value gap. This FVG is the first entry opportunity in Phase 3:
- Judas Swing sweeps SSL below the accumulation range
- Reversal begins (LTF CHoCH confirms)
- Initial distribution impulse creates a bullish FVG
- Price briefly retraces into the FVG
- Entry at the FVG's CE
- Stop below the Judas Swing's swept low
- Target: the next BSL above
AMD and Premium/Discount Zones
The Judas Swing typically drives price into the discount zone (for bullish days) or the premium zone (for bearish days):
- On a bullish day, the Judas Swing (bearish manipulation) drives price below equilibrium into the discount zone — the cheapest price level available within the current range
- On a bearish day, the Judas Swing (bullish manipulation) drives price above equilibrium into the premium zone
The convergence of AMD timing (manipulation phase) and premium and discount positioning creates the highest-probability confluence in the SMC framework.
Part 8: Stock-Specific AMD Application
US Equity Markets and AMD Timing
Pre-Market (4:00–9:30 AM ET) = Accumulation: Pre-market trading is the stock market's equivalent of the Asian session. Mark the pre-market high and low — these are the Phase 2 targets.
Market Open + First 30 Minutes (9:30–10:00 AM ET) = Manipulation: The US equity market open is one of the most reliably manipulative periods in any market. This is where the Judas Swing occurs for US stocks. The opening 30 minutes frequently sees price spike in the opposite direction of the day's real move before reversing.
10:00 AM–12:00 PM ET = Distribution: This is the primary distribution window for US stocks. Once the Judas Swing has completed and the lower-timeframe CHoCH confirms, price typically delivers its real directional move during this window.
Volume — The AMD Confirmation Tool for Stocks
Phase 1 (Accumulation): Volume is typically below the 20-period average.
Phase 2 (Manipulation — Judas Swing): Volume spikes significantly as stop orders trigger. The spike and immediate fade is the most reliable confirmation that the Judas Swing has occurred.
Phase 3 (Distribution): Volume expands in the direction of the real move. Above-average, sustained volume throughout the distribution phase confirms institutional participation.
Pro Tip: The volume profile of AMD is the most reliable tool for US stock traders to distinguish a true Judas Swing from a genuine breakout. Genuine breakouts have sustained volume in the breakout direction. Judas Swings spike on the initial move then volume immediately fades as price reverses. This volume pattern — spike-fade-reversal — is the intraday fingerprint of institutional manipulation.
Part 9: AMD Trading Strategy — Step-by-Step Execution
Pre-Session Preparation
Step 1 — Establish the higher timeframe context: Is the daily structure bullish (HH/HL) or bearish (LH/LL)? Where is price within the weekly dealing range?
Step 2 — Identify unmitigated daily PD arrays: These are the likely targets for today's distribution phase — and the entry zones after the Judas Swing.
Step 3 — Mark the Asian session range: Identify the pre-market high and low. These are the Judas Swing targets.
Step 4 — Set alerts: Place price alerts just beyond the pre-market high and low.
Session Execution
9:30–9:45 AM ET — Watch the Open: Do not enter in the first 5 minutes. Watch which direction price moves first.
9:45–10:00 AM ET — Identify the Judas Swing: If price spikes below the pre-market low (on a bullish bias day), watch for: (1) price spikes beyond the range level, (2) volume spikes then fades immediately, (3) price begins to reverse back inside the range.
10:00–10:15 AM ET — Lower Timeframe Confirmation: Drop to the 5-minute chart. Wait for the bullish CHoCH after the sell-side sweep.
10:15–10:30 AM ET — Entry: After CHoCH confirmation, enter at the first PD array created by the initial distribution displacement.
Stop Loss: Below the Judas Swing's swept low with ATR buffer.
Target: The next buy-side liquidity pool above.

Dhanith Trading Journal
Track every trade. Find your real edge.
Log your setups, grade your entries, and review your trading patterns — all in one place. The journal built for serious SMC traders.
Part 10: Common AMD Mistakes and Exact Fixes
Mistake 1 — Entering During the Manipulation Phase
The fix: The manipulation phase is never traded, only observed. When price spikes beyond the range, your action is to watch, mark the swept level, and wait for the lower timeframe CHoCH to confirm the reversal.
Mistake 2 — Forcing AMD Onto Every Candle and Every Day
The fix: AMD is most reliable on specific timeframes. For intraday stock trading: focus on the daily AMD cycle. Do not apply AMD to every 5-minute candle.
Mistake 3 — Not Having a Pre-Established Daily Bias
The fix: Before every session, establish the daily bias from the daily chart structure and the premium/discount zone position. The bias is set before the session, not determined by the opening move.
Mistake 4 — Confusing a Genuine Breakout with the Judas Swing
The fix: Apply the volume and candle close filters:
- Genuine breakout: Candles continue to close beyond the broken level; volume remains elevated or expands; no immediate reversal within 3–5 candles
- Judas Swing: Candle closes back inside the range within 1–3 candles; volume spikes then immediately fades; sharp reversal begins
Mistake 5 — Entering Too Late in the Distribution Phase
The fix: The first PD array created during the initial distribution displacement offers the tightest stop and the largest target. Missing this entry means waiting for the next AMD cycle — not chasing.
Mistake 6 — Ignoring Session Timing
The fix: For US stock AMD trading, confine active trading to the NY AM session (9:30 AM–12:00 PM ET). Setups that form after 12:00 PM have lower probability and reduced institutional participation.
FAQ
Q: What is the AMD cycle in trading? AMD (Accumulation, Manipulation, Distribution) is a three-phase framework describing how institutional price delivery operates in every liquid market and every timeframe. Accumulation is the quiet position-building range. Manipulation is the deliberate false move (Judas Swing) that traps retail traders and collects liquidity. Distribution is the real institutional directional move that follows.
Q: What is the Judas Swing in ICT trading? The Judas Swing is the manipulation phase of the AMD cycle — a deliberate spike in the opposite direction of the day's real intended move. On a bullish day, the Judas Swing drives price below the Asian/pre-market session low before reversing sharply upward. On a bearish day, it spikes above the session high before reversing downward.
Q: Is the AMD cycle the same as ICT Power of 3? Yes. AMD (Accumulation, Manipulation, Distribution) and ICT Power of 3 (PO3) describe the same three-phase institutional delivery cycle. AMD emphasizes the behavioral description of each phase; PO3 emphasizes the geometric reading of a candle's OHLC structure.
Q: What timeframes does the AMD cycle work on? AMD is fractal — it appears at every timeframe simultaneously. Quarterly AMD (Q1=accumulate, Q2=manipulate, Q3=distribute). Monthly (week 1 accumulates, week 2 manipulates, weeks 3–4 distribute). Weekly (Monday–Tuesday accumulate, Tuesday–Wednesday manipulate, Thursday–Friday distribute). Daily (Asian accumulates, London manipulates, NY distributes).
Q: How do I determine the daily bias for AMD trading? Establish the daily bias before the session opens by examining: (1) the daily chart's market structure — bullish or bearish; (2) the premium/discount zone position; (3) any significant HTF OBs or FVGs approaching. Never let the opening move determine the bias — that is the Judas Swing, not the real direction.
Q: When should I enter during the AMD cycle? Only during Phase 3 (Distribution) — never during Phase 1 (Accumulation) or Phase 2 (Manipulation). Specifically: after the Judas Swing completes and the lower timeframe CHoCH confirms the reversal, enter at the first PD array created during the initial distribution displacement.
Conclusion
The AMD cycle is not a trading pattern. It is the foundational framework for understanding how institutional price delivery actually works.
The three principles to carry forward:
1. Every significant price cycle has three phases. Whether you're looking at a quarterly chart, a daily candle, or a 15-minute intraday structure — accumulation precedes manipulation precedes distribution. Every single time.
2. The manipulation is the signal, not the trade. When price spikes through the accumulation range in the wrong direction — that spike is your signal that the real move is about to begin in the opposite direction.
3. Establish bias before the session, not during it. Pre-session higher timeframe analysis establishes the bias. The session executes it. These two activities must stay separate.
Related Articles
- Smart Money Concepts: The Complete Mastery Guide — The complete institutional trading framework that the AMD cycle is a core component of
- SMC Market Structure: BOS, CHoCH and Strong vs Weak Levels — How to read the structural signals (BOS and CHoCH) that confirm the transition from Phase 2 manipulation to Phase 3 distribution
- Liquidity Sweeps: The Complete Mastery Guide — The Judas Swing is a liquidity sweep — learn the full mechanics of how stop hunts work and how to enter after them
- Fair Value Gaps: The Complete Mastery Guide — FVGs created during the initial distribution phase are the highest-probability entry zones in the AMD framework
- Inducement (IDM): The Complete SMC Guide — The AMD manipulation phase is essentially inducement at the session level — learn how to anticipate and trade around it
- SMC Killzones: The Complete Trading Guide — The AMD cycle and killzones are the same framework — killzones tell you exactly when each AMD phase is most active
Disclaimer: This article is for educational purposes only and does not constitute financial or investment advice. Stock trading involves significant risk of loss. Past performance does not guarantee future results. Always use proper risk management and only trade with capital you can afford to lose.
Continue Reading

