
SMC Market Structure: Higher Highs, Higher Lows, BOS, CHoCH and Strong vs. Weak Levels Explained (2026)
Master SMC market structure for stocks. Learn how to read higher highs, higher lows, Break of Structure (BOS), Change of Character (CHoCH), and strong vs. weak swing levels with step-by-step examples.
Introduction
Every single trade decision in Smart Money Concepts begins with the same question: What is the market structure right now?
Not which order block to enter at. Not which fair value gap to target. Not what the RSI says. Structure first — always.
Market structure is the skeleton of price action. It tells you the direction institutions are pushing price, where the most important levels are, and critically — whether a trend is still alive or quietly dying. Without reading it correctly, every other SMC concept you apply is built on a cracked foundation.
Most traders understand the basics — higher highs mean uptrend, lower lows mean downtrend. What separates consistently profitable SMC traders from those who lose is understanding the nuance: the difference between a Break of Structure and a Change of Character, why some swing levels hold under pressure and others collapse, how internal and external structure interact, and when a market structure shift is real versus a liquidity trap.
This guide covers all of it. Step by step, with clear examples. By the end, you will be able to read any stock chart and determine — within 60 seconds — the structural bias, the key levels that matter, and the direction you should be looking to trade.
TL;DR — Key Takeaways
- Market structure has three states: uptrend (HH/HL), downtrend (LH/LL), and range (consolidation)
- A Break of Structure (BOS) confirms trend continuation — trade with it
- A Change of Character (CHoCH) is the first warning of trend reversal — wait for confirmation
- A Market Structure Shift (MSS) is a CHoCH confirmed with displacement — stronger reversal signal
- Strong swing levels caused a BOS; weak levels didn't — weak levels get taken out, strong levels hold
- Internal structure exists inside external structure — use external for bias, internal for entries
- Higher timeframe structure always overrides lower timeframe structure — no exceptions
What Is Market Structure? The Foundation of Every SMC Trade
Market structure is the sequence of swing highs and swing lows that price leaves behind as it moves. That's it. No indicators. No formulas. Just the peaks and troughs on a price chart — read in the right sequence.
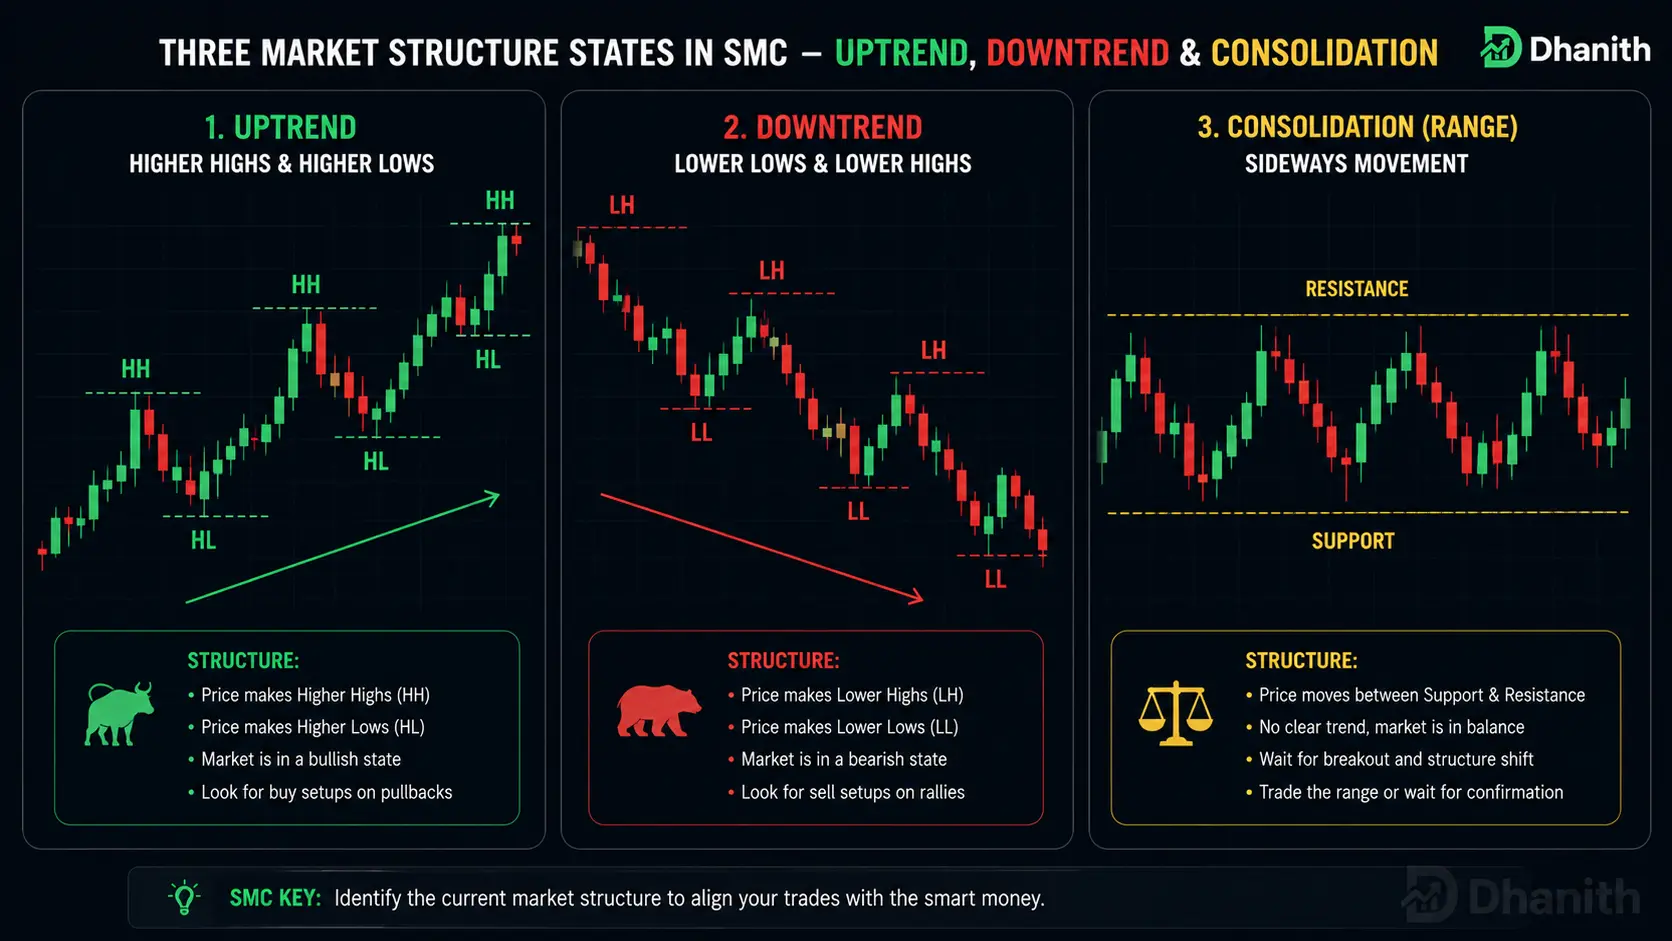
Every market, on every timeframe, is always in one of three states:
State 1 — Uptrend (Bullish Structure): Price makes Higher Highs (HH) and Higher Lows (HL). Each rally clears the previous peak. Each pullback holds above the previous trough. Buyers are in control.
State 2 — Downtrend (Bearish Structure): Price makes Lower Highs (LH) and Lower Lows (LL). Each rally fails below the previous peak. Each decline breaks below the previous trough. Sellers are in control.
State 3 — Consolidation (Range): Price oscillates between a defined ceiling and floor without creating meaningful new highs or lows. Neither buyers nor sellers have decisive control. A large directional move is building.
Why does this matter before everything else? Because your directional bias — the single most important variable in any trade — comes entirely from market structure. A bullish structure means you look for longs. A bearish structure means you look for shorts. A consolidation means you wait.
Entering trades without first identifying the structure is the equivalent of driving without knowing which direction you're going. You might get lucky occasionally. But you won't be consistent.
Pro Tip: Before any other analysis — before marking order blocks, FVGs, or liquidity levels — open the daily chart and ask three questions: Is structure bullish or bearish? Has there been a recent BOS or CHoCH? Where are the most recent swing highs and lows? Answer those three questions and your entire analysis framework falls into place.
Part 1: The Three Market States in Detail
Uptrend — Higher Highs and Higher Lows
An uptrend is confirmed by two consecutive structural conditions occurring together:
- Price rallies to a new high that exceeds the previous peak — Higher High (HH)
- Price pulls back but holds above the previous trough before continuing upward — Higher Low (HL)
As long as this sequence continues — HH followed by HL, then another HH — the uptrend is structurally intact. Institutions are accumulating. Smart money is buying pullbacks. You look for long setups on retracements, not shorts.
The critical rule for uptrend analysis: The uptrend is only intact as long as the most recent Higher Low holds. The moment price breaks below the most recent HL, the structural assumption of a bullish trend is no longer valid. This is where the Change of Character (CHoCH) comes in — covered in Part 3.
What a healthy uptrend looks like in practice:
- Pullbacks are shallow and brief — price doesn't retrace deeply before continuing higher
- Volume expands on rally legs and contracts on pullbacks
- Each BOS is confirmed with a decisive candle close, not just a wick
- The distance between swing lows is consistent — not shrinking (which signals exhaustion)
Downtrend — Lower Highs and Lower Lows
A downtrend is the mirror image: price makes Lower Highs (LH) and Lower Lows (LL) in sequence.
- Price rallies but fails to reach the previous peak — Lower High (LH)
- Price declines past the previous trough — Lower Low (LL)
As long as this sequence continues, sellers are in control. Institutions are distributing. You look for short setups on rallies, not longs.
The downtrend remains intact as long as the most recent Lower High holds. The moment price breaks above the most recent LH, the bearish structural assumption is challenged — and a potential CHoCH is forming.
Consolidation — The Range Phase
Consolidation forms when neither buyers nor sellers can dominate. Price bounces between a horizontal resistance (ceiling) and a horizontal support (floor) without making meaningful new highs or lows.
Consolidation is not a bad thing — it's where institutional accumulation and distribution happen. The quiet, boring, range-bound price action that frustrates retail traders is exactly when smart money is quietly building positions.
How to identify a genuine consolidation vs. a ranging mess:
- Clear, horizontal ceiling and floor that price has respected multiple times
- Decreasing volatility — candles getting smaller, ranges tightening
- Volume declining within the range (accumulation) or high volume on failed breakouts (distribution)
What to do in consolidation: Mark the top and bottom of the range. The top holds liquidity (buy stops and short stop losses). The bottom holds liquidity (sell stops and long stop losses). Wait for price to sweep one side of the range liquidity before positioning for the breakout in the opposite direction.
Warning: Consolidation is where overtrading kills accounts. The false breakouts, the choppy price action, and the tight ranges encourage traders to take every minor swing as a new trend. In consolidation, most signals are noise. Wait for a confirmed BOS out of the range before committing to a directional bias.
Part 2: Break of Structure (BOS) — Trend Continuation Confirmed
A Break of Structure (BOS) occurs when price breaks beyond a significant swing point in the direction of the existing trend. It is a continuation signal — evidence that the current trend has momentum and institutional support.
Bullish BOS
In an uptrend, a bullish BOS occurs when price breaks above the most recent Higher High. This creates a new HH, confirming:
- Buyers are still active and in control
- The uptrend has fuel — institutions are continuing to push price higher
- The last swing low (which will become the new Higher Low) is a level of institutional interest
After a bullish BOS: The pullback that follows is a buying opportunity, not a reversal signal. Look for the retracement to reach an order block, fair value gap, or demand zone left by the BOS impulse — and enter long there.
Bearish BOS
In a downtrend, a bearish BOS occurs when price breaks below the most recent Lower Low. This creates a new LL, confirming sellers remain in control.
After a bearish BOS: The rally that follows is a shorting opportunity. Look for price to retrace to a supply zone, order block, or fair value gap left by the BOS impulse — and enter short there.
What Makes a Valid BOS
Not every candle that pokes through a swing point is a genuine BOS. Three conditions must be met:
Condition 1 — Candle Close, Not Just a Wick A wick that extends beyond a swing high and immediately retreats is almost always a liquidity sweep — not a BOS. A valid BOS requires the candle to close beyond the swing point. Closing above (bullish) or closing below (bearish) is confirmation. A wick alone is not.
Condition 2 — Displacement The move breaking structure should be impulsive — large candles, minimal overlap, clear directional momentum. A slow grind through a swing level lacks institutional conviction. A sharp, decisive break with large candles shows genuine institutional participation.
Condition 3 — Structural Significance of the Level The swing point being broken must be a meaningful structural level, not a minor internal swing that barely forms. The more significant the swing high or low — the more times it was tested, the more clearly it formed — the more meaningful the BOS becomes.
Pro Tip: Volume is the often-ignored confirmation tool for BOS. A break of structure accompanied by volume 1.5x or more above the 20-period average confirms institutional participation. A BOS on thin volume is suspicious — it may resolve as a failed breakout or inducement.
Part 3: Change of Character (CHoCH) — The First Reversal Warning
If a BOS confirms the trend is continuing, a Change of Character (CHoCH) is the market's first admission that the trend may be ending. It is the most important early warning signal in all of SMC.
Bearish CHoCH (Uptrend Weakening)
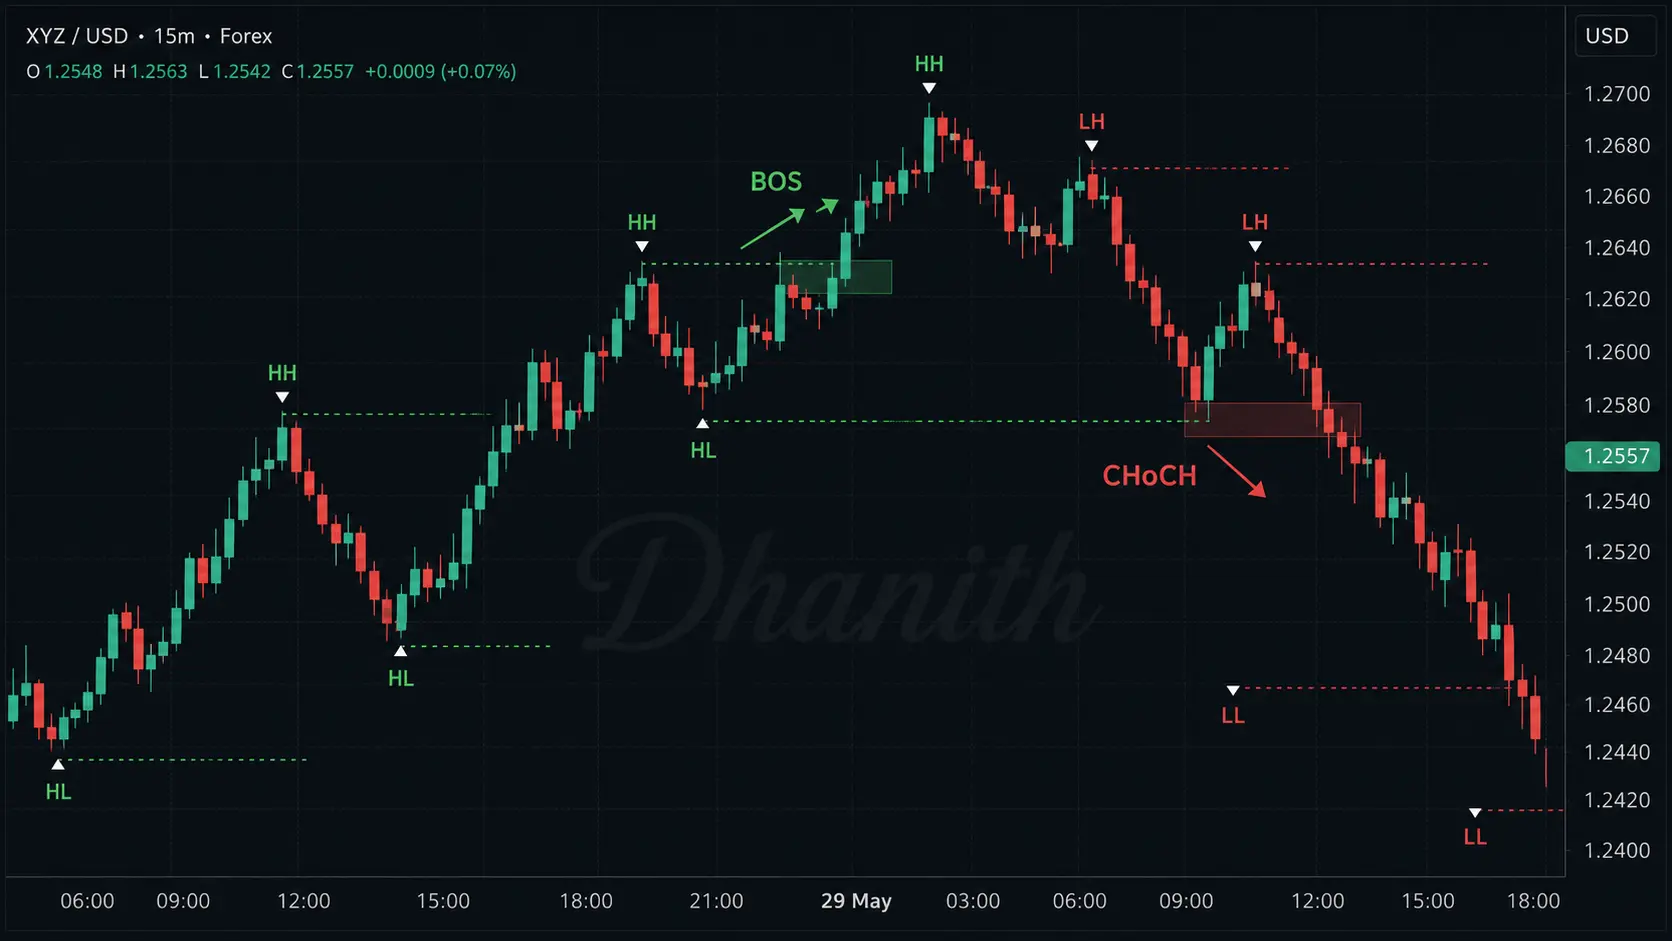
In an established uptrend (sequence of HH and HL), a bearish CHoCH occurs when price breaks below the most recent Higher Low for the first time.
This is significant because the entire uptrend structure depends on Higher Lows holding. When the most recent HL is broken, the chain of HH/HL is broken. The market is telling you: buyers failed to defend the level they needed to hold.
This does not guarantee an immediate reversal. The market could:
- Begin a full trend reversal into a downtrend
- Transition into a ranging, consolidation phase before resuming the uptrend
- Create a deeper correction before the uptrend continues (in this case, the CHoCH would be followed by a new BOS above the previous HH)
The rule: A CHoCH tells you to stop looking for longs in the existing trend. It does not tell you to immediately go short. Wait for confirmation — specifically, a Market Structure Shift (MSS) or a second structural break — before committing to the reversal trade.
Bullish CHoCH (Downtrend Weakening)
In an established downtrend (sequence of LH and LL), a bullish CHoCH occurs when price breaks above the most recent Lower High for the first time.
This breaks the chain of LH/LL that defines the downtrend. Sellers failed to hold their most recent swing high. Buyers are beginning to assert themselves.
Same rule applies: a bullish CHoCH means stop looking for shorts. Don't immediately go long. Wait for confirmation.
The Critical CHoCH Rule Most Traders Miss
Here is the nuance that separates traders who consistently misread structure from those who don't:
A valid CHoCH must break the swing point that was created by the most recent BOS — not just any minor internal swing.
If price is in an uptrend and makes a BOS above a swing high, the Higher Low that forms after that BOS is the structural HL that matters. Only a break of that HL constitutes a CHoCH. Breaking a minor internal swing that formed during the pullback — one that never played a role in the BOS sequence — is not a CHoCH. It's noise.
Getting this wrong is the single most common source of misread structure in SMC. Traders see price dip below any recent low and call it a CHoCH, then wonder why the "reversal" never follows through.
Warning: A CHoCH does not guarantee reversal. In a strong uptrend, a bearish CHoCH may simply mark a deeper correction — a pullback to a demand zone — before the uptrend resumes with a new BOS above the previous high. Always treat CHoCH as a warning requiring confirmation, not as a standalone short signal.
Part 4: Market Structure Shift (MSS) — The Confirmed Reversal
A Market Structure Shift (MSS) is the stronger version of a CHoCH. Where a CHoCH is the first warning, an MSS is the confirmation.
The difference is displacement.
A CHoCH can occur with a slow, grinding candle close beyond a swing point. An MSS requires that same break to happen with a strong displacement candle — a large, impulsive close that clearly penetrates the swing point with conviction.
In practice, the sequence often unfolds like this:
- CHoCH appears first — price breaks the structural swing with moderate momentum, providing the early warning
- MSS confirms — the next impulsive leg extends beyond that level with a strong displacement candle, confirming the reversal is institutional, not retail noise
MSS vs. BOS vs. CHoCH — The Summary:
| Signal | Direction | Meaning | Action |
|---|---|---|---|
| BOS | With the trend | Trend continuation confirmed | Look for entries with the trend |
| CHoCH | Against the trend | First reversal warning | Stop trading with the trend; wait for confirmation |
| MSS | Against the trend | Reversal confirmed with displacement | Begin looking for reversal entries |
Pro Tip: In practice, MSS is the entry trigger. When you see a CHoCH, you put the old trend on pause. When the MSS confirms with a displacement candle and a fair value gap forms in the new direction, that is where the high-probability reversal trade begins.
Part 5: Strong vs. Weak Swing Levels — The Hidden Filter
This is the concept that separates intermediate SMC traders from advanced ones. Not all swing highs and lows are equal. Understanding which ones will hold and which ones will collapse dramatically improves trade selection.
Strong Swing Levels
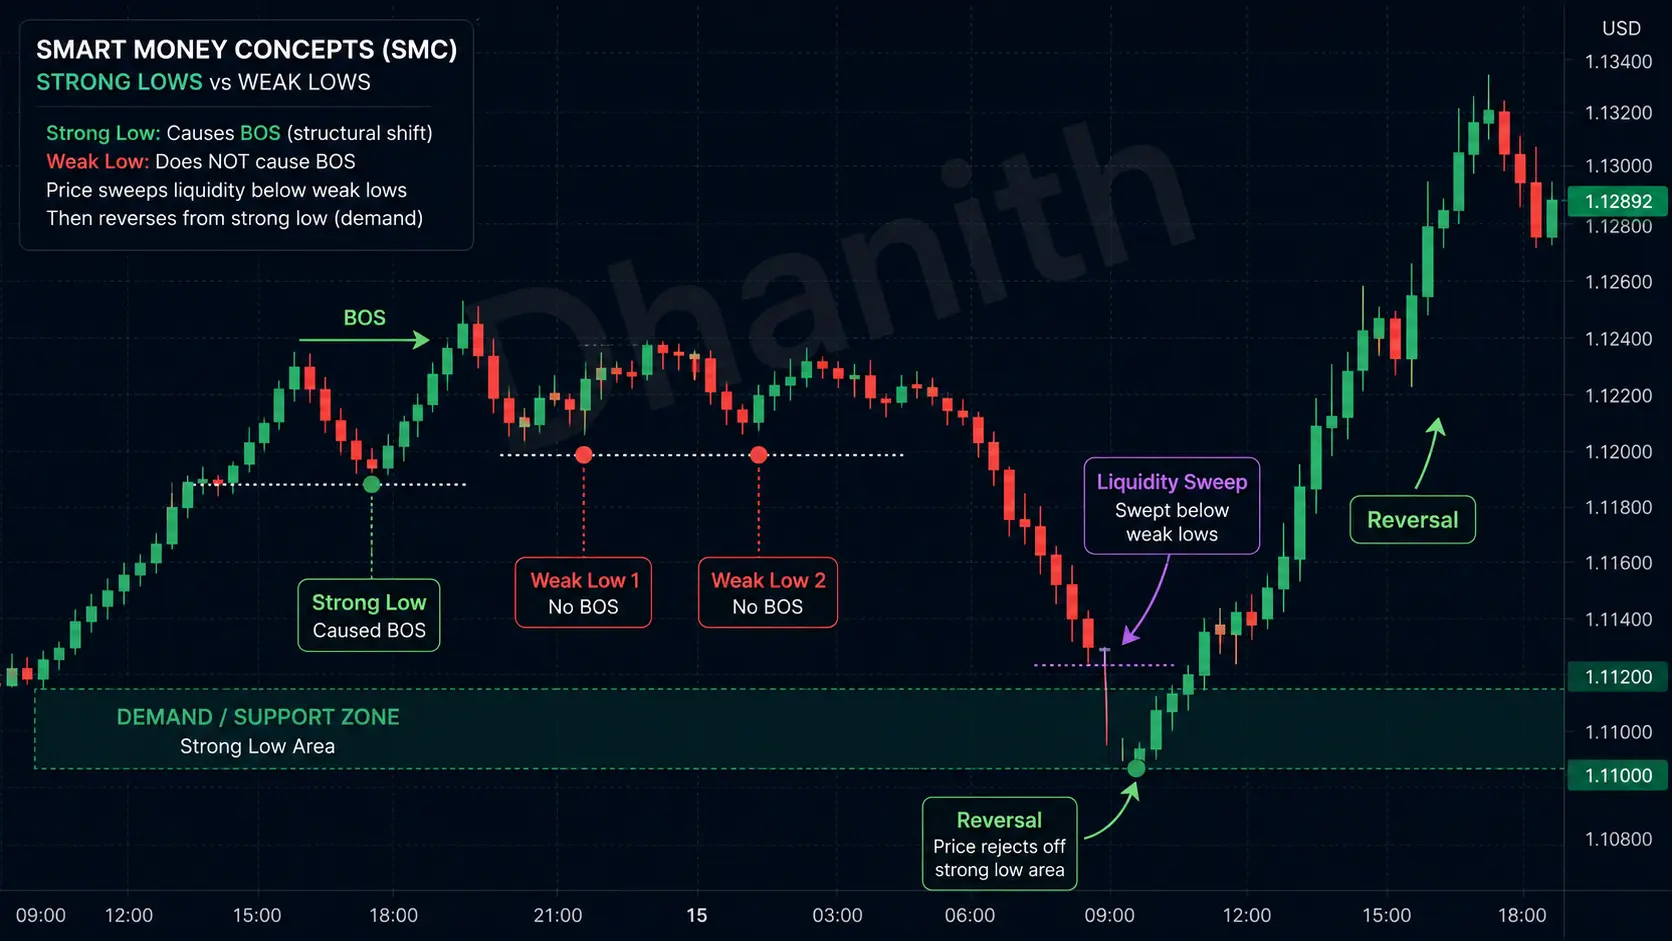
A strong swing high or low is one that caused a Break of Structure. It is the swing point from which an impulsive move originated — a move that broke a prior structural level.
Why strong levels hold: When a swing low causes a bullish BOS, that low represents a zone where institutional buying was so powerful it drove price through a prior swing high. Those same institutional buyers — with remaining orders — are likely to defend that level if price returns to it. This is precisely the location of a valid order block.
Strong lows are where you place buy orders. Strong highs are where you place sell orders.
Visual identification: Mark the swing low or high that directly preceded the impulsive BOS candle. That is the strong level. It has genuine institutional interest behind it.
Weak Swing Levels
A weak swing high or low is one that did not cause a Break of Structure. It formed as part of a pullback or correction but was not the origin of a move that broke prior structure.
Why weak levels fail: Weak levels represent price areas where retail traders place stops and pending orders, but where no significant institutional interest has been demonstrated. When price returns to a weak level, there's no genuine institutional "wall" defending it. It gets taken out — often serving as a liquidity sweep before price reverses from the nearby strong level.
Practical application: When price retraces toward a cluster of swing lows, you need to ask: which of these lows is strong and which is weak? The strong low is your entry zone. The weak lows between price and the strong level will likely be swept — triggering the stop losses of retail traders who entered at those weak lows — before price reverses.
This is why entries at weak levels get stopped out. And why entries at strong levels, even after being tested, often hold precisely.
How to Identify Strong vs. Weak in Real Time
Step 1: Mark every recent swing high and low on your chart.
Step 2: For each swing, ask: "Did the move from this swing point break a prior structural level (create a BOS)?" If yes — strong. If no — weak.
Step 3: When price retraces toward a cluster of levels, prioritize the strong level. Mark weak levels as likely liquidity targets that will be swept on the way to the strong level.
Step 4: When price sweeps the weak levels and reaches the strong level, watch for reaction. A bullish candle pattern (hammer, engulfing) at a strong low — especially one with a CHoCH on the lower timeframe — is your entry signal.
Part 6: Internal vs. External Market Structure
SMC introduces a critical distinction that most retail traders never learn: market structure exists simultaneously on two levels.
External Structure — The Macro Picture
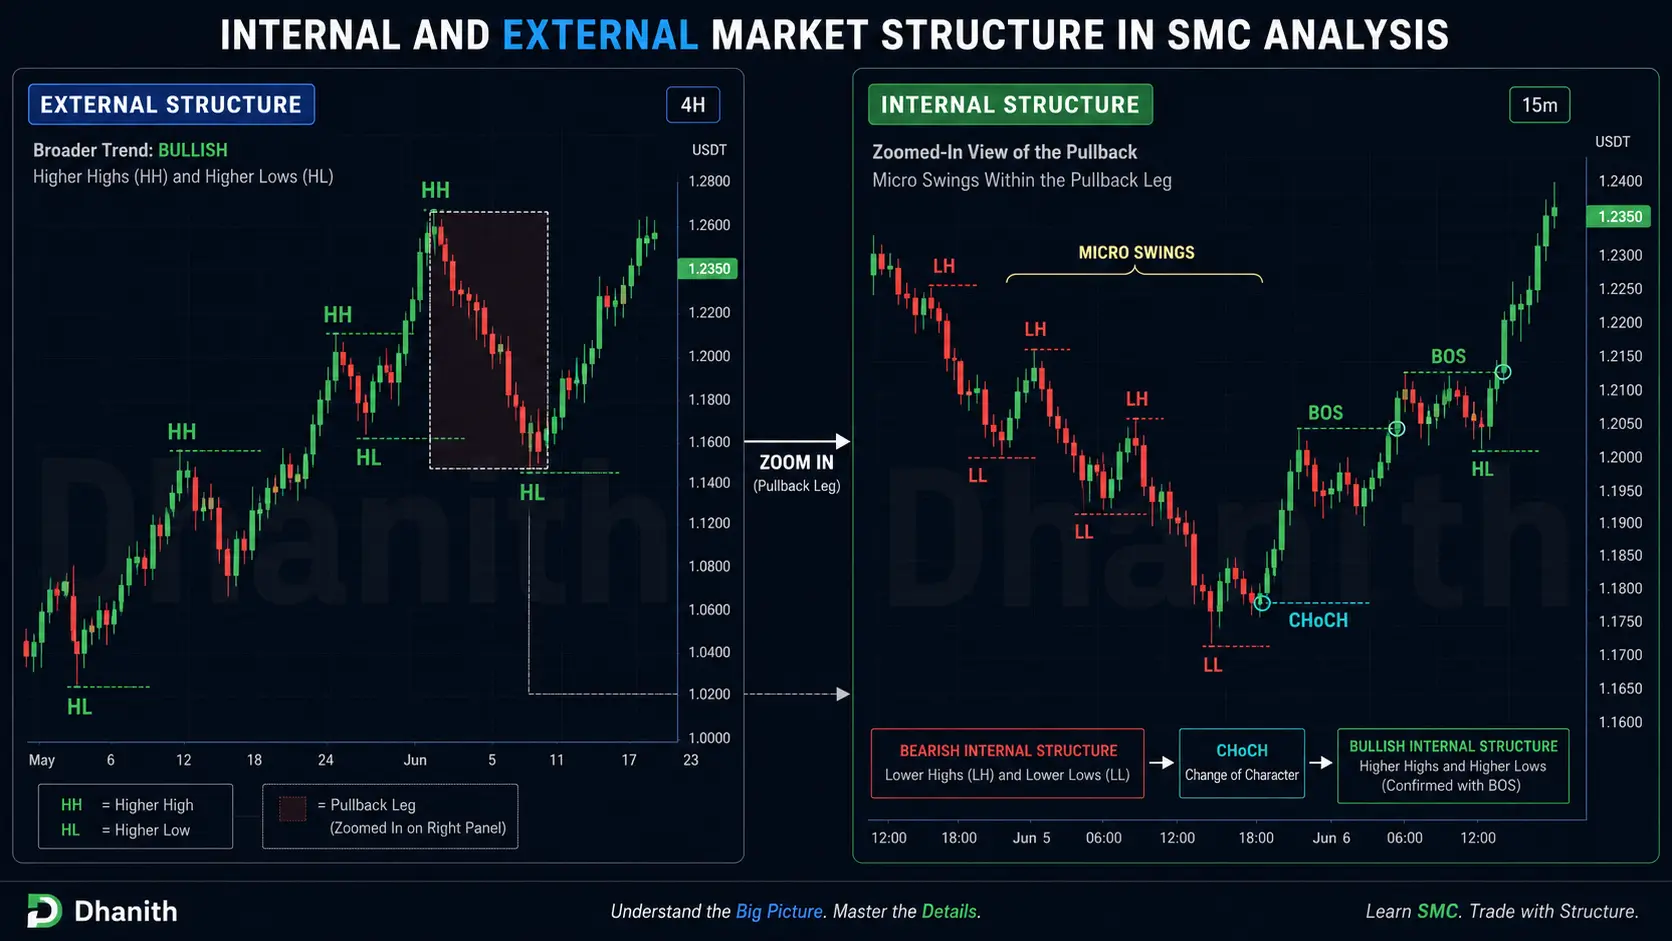
External structure refers to the major swing highs and lows on your current timeframe — the ones that define the overall trend direction. These are the peaks and troughs that are clearly visible, obviously significant, and represent the institutional intent of the market at that level.
External structure is where you read the trend. External swing points are the BOS and CHoCH levels you mark. External structure sets your directional bias.
The rule: Always define the trend from external structure. This is non-negotiable.
Internal Structure — The Entry Tool
Internal structure refers to the smaller swings that form inside each leg of the external structure. These are the minor peaks and troughs that occur during pullbacks and corrections — visible on your current timeframe but not structurally significant to the overall trend.
Internal structure is where you time entries. When price retraces from a bullish BOS back toward your bullish order block, the smaller swing highs and lows that form during that retracement are internal structure. A CHoCH on the internal structure — price breaking a minor internal Lower High — is the entry confirmation that buyers are stepping in at your zone.
The Rule: External for Bias, Internal for Entry
This is the framework in one sentence: Use external structure to determine what direction to trade. Use internal structure to time when to enter.
If external structure is bullish and price is pulling back to your order block zone, you don't enter immediately. You watch for internal structure to shift — a minor internal CHoCH showing buyers are absorbing selling pressure. That internal shift is your trigger.
Warning: The single most dangerous mistake in structure analysis is this: using internal structure to override external structure. A bullish CHoCH on the 15-minute chart does not mean "go long" if the daily external structure is bearish. Internal structure only matters within the context of the higher timeframe external structure. The moment you trade an internal signal against the external bias, your probability collapses.
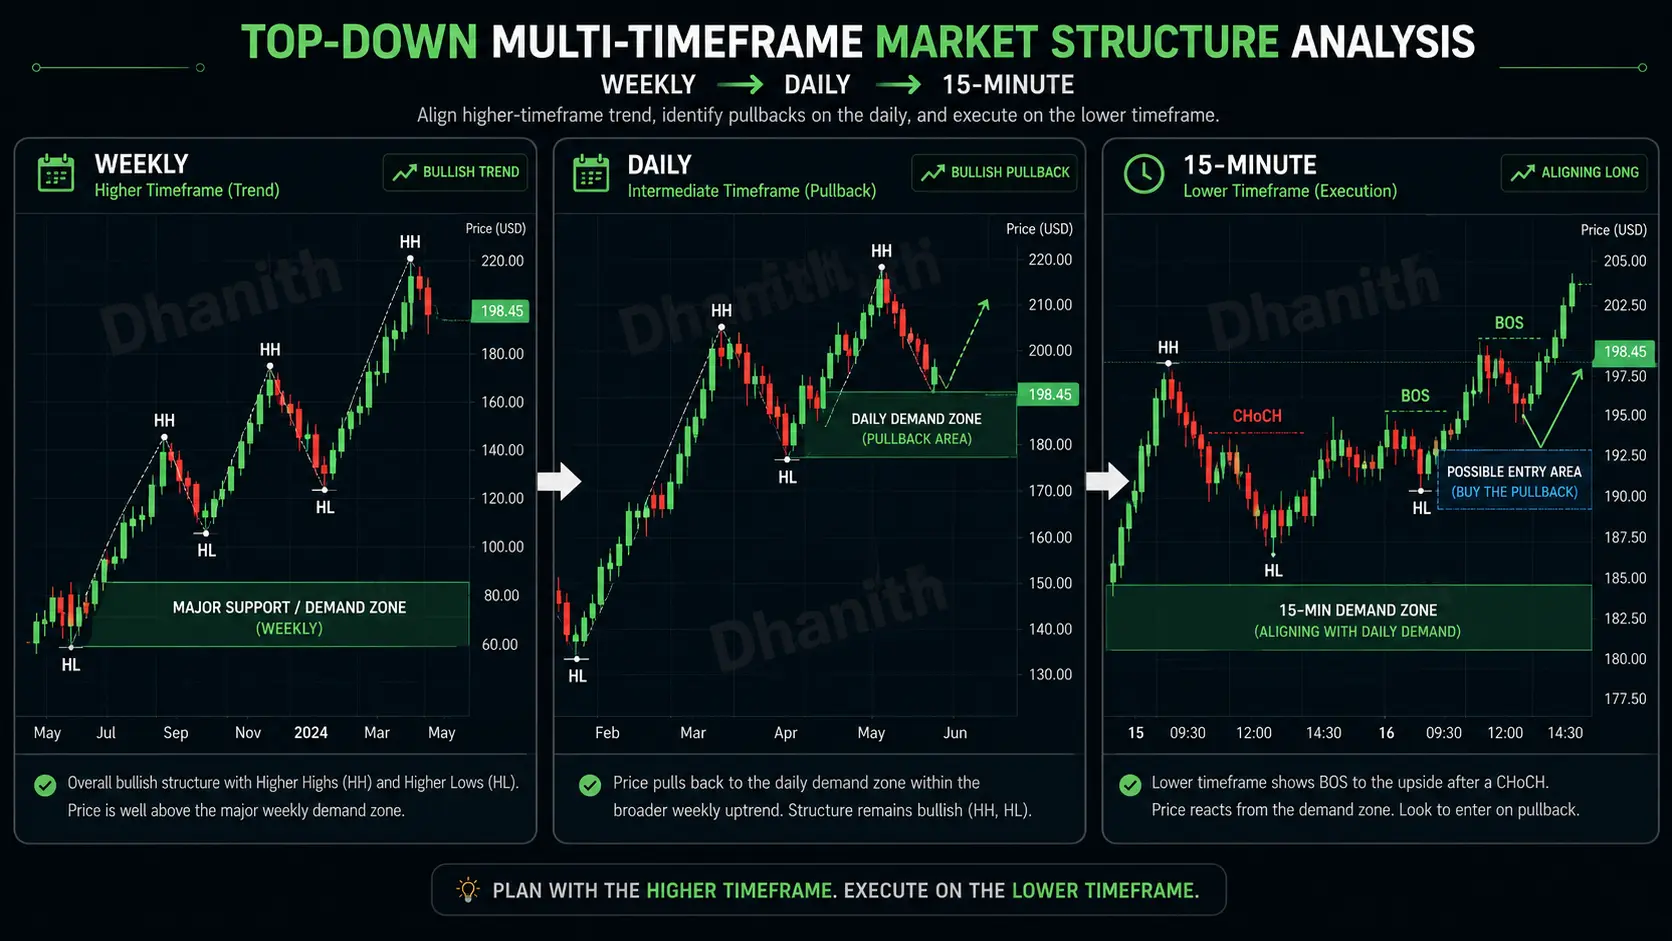
Part 7: Multi-Timeframe Structure — The Top-Down Framework
Understanding structure on a single timeframe is not enough. Professional SMC traders use a top-down, multi-timeframe approach that aligns structural readings across at least three timeframes.
The Three-Tier Structure Framework for Stocks
| Timeframe | Role | Questions to Answer |
|---|---|---|
| Weekly | Macro bias | What is the dominant long-term trend? Where are major swing levels? |
| Daily | Trade direction | Is the daily structure bullish or bearish? Recent BOS or CHoCH? |
| 4-Hour | Zone identification | Where are unmitigated OBs and FVGs? Where is price within the daily range? |
| 15-Minute | Entry confirmation | Is there an internal CHoCH or MSS confirming entry at the zone? |
The top-down process:
Step 1 — Weekly chart: Identify the macro structure. Is the stock in a long-term uptrend or downtrend? Mark the major swing highs and lows. These are the most significant liquidity levels and structural reference points.
Step 2 — Daily chart: This is your trade direction chart. Confirm the daily structure is aligned with the weekly bias. Identify the most recent BOS or CHoCH on the daily. Mark the key daily swing levels — strong and weak — and note whether price is approaching a structural zone.
Step 3 — 4-Hour chart: Zoom in to find your institutional zones. Unmitigated order blocks and unfilled FVGs that align with the daily bias are your trade setups. Mark them. Note whether they sit in premium or discount relative to the current daily range.
Step 4 — 15-Minute chart: This is your entry timeframe. When price reaches your 4H zone, watch the 15-minute chart for an internal structure shift — a CHoCH or MSS in the direction of the higher timeframe bias. This is your trigger.
The cardinal rule of multi-timeframe analysis: Higher timeframe structure always overrides lower timeframe structure. A bullish 15-minute structure inside a bearish daily trend is a counter-trend move, not a valid long setup. If you're fighting the daily trend on a 15-minute chart, you are playing the lowest probability version of any trade.
Part 8: Common Market Structure Mistakes and How to Fix Them
Mistake 1 — Marking Too Many Swing Points
Looking at a chart covered in marked swing highs and lows. When every peak and trough is labeled, the important levels lose their significance and the chart becomes unreadable.
The fix: Only mark swing points that are visually significant — ones that caused a clear directional change, attracted obvious price reaction, or resulted in a BOS or CHoCH. Minor internal wiggles don't need marks.
Mistake 2 — Treating Every CHoCH as an Immediate Reversal Entry
Entering short the moment a bearish CHoCH appears on the 15-minute chart, only to get stopped out as the uptrend resumes.
The fix: CHoCH is a warning, not an entry trigger. After a CHoCH, wait for (a) a liquidity sweep of the most obvious nearby level, (b) an MSS confirmation with displacement, and (c) an internal structure shift on the entry timeframe. Only then consider entering.
Mistake 3 — Confusing Wicks with BOS
A candle wicks above a swing high on low volume and retail traders call it a bullish BOS and buy. Price reverses immediately.
The fix: A valid BOS requires a candle close beyond the swing point, not just a wick. Wicks through levels without closes are almost always liquidity sweeps — price collecting the buy stops above the high before reversing downward. Wait for the close.
Mistake 4 — Using Lower Timeframe Structure to Override Daily Bias
Seeing a "beautiful" bullish CHoCH on the 5-minute chart and going long, completely ignoring that the daily chart is in a clear bearish downtrend.
The fix: The daily structure is your directional filter. If the daily is bearish, you are only looking for shorts — regardless of what any lower timeframe shows. The only exception: the daily is showing a bullish CHoCH or MSS, suggesting the daily trend itself is reversing.
Mistake 5 — Calling Structure in a Range
Attempting to read HH/HL or LH/LL within a tight consolidation range. Every minor bounce becomes an "uptrend" and every minor dip becomes a "downtrend" in the trader's analysis.
The fix: Recognize consolidation for what it is. If price is oscillating between two horizontal levels without making meaningful new highs or lows, declare it a range and stop trying to find trend structure within it. Mark the range boundaries, wait for a BOS out of the range, and then begin reading structure in the new trend.
Part 9: Reading Market Structure on Stock Charts — A Step-by-Step Example
Here is how to apply every concept in this guide to a real stock analysis in under 5 minutes.
Example Stock: Large-cap US equity, daily timeframe
Step 1 — Open the daily chart and identify the macro structure: You observe: price has been making Higher Highs and Higher Lows for the past 3 months. The most recent move created a new HH with a large bullish displacement candle. Structure is bullish.
Step 2 — Identify the most recent swing points and classify them: The swing low that caused the most recent BOS (above the prior HH) is a strong low. The minor swing lows that formed during the pullback before the BOS are weak lows.
Step 3 — Check for any CHoCH: No bearish CHoCH visible — the most recent Higher Low has not been broken. Daily bias remains bullish.
Step 4 — Mark key zones on the 4-hour chart: You drop to the 4H chart. You identify an unmitigated bullish order block at the strong daily swing low. There is also a bullish FVG left by the BOS impulse, sitting in the discount zone below equilibrium. These are your trade zones.
Step 5 — Wait and monitor the 15-minute chart: Price begins pulling back toward your 4H bullish OB. On the 15-minute chart, you watch as price enters the OB zone. A minor bearish internal structure (lower highs and lower lows on the 15M) is present during the pullback. Then — a bullish 15-minute CHoCH: price breaks above the most recent 15M Lower High. Internal structure has shifted bullish.
Step 6 — Entry: You enter long after the 15M CHoCH candle closes. Stop below the OB low (below the strong daily swing low). Target: the next buy-side liquidity above the most recent daily Higher High. Risk-reward: 2.8:1.
That is the complete market structure read — from daily bias to entry trigger — using nothing but the concepts in this guide.
FAQ
Q: What is the difference between BOS and CHoCH in SMC? A Break of Structure (BOS) confirms the current trend is continuing — price breaks a swing point in the same direction as the trend. A Change of Character (CHoCH) is the opposite — price breaks a swing point against the current trend, signaling the trend may be reversing. BOS tells you to keep trading with the trend. CHoCH tells you to stop and wait for reversal confirmation.
Q: How do you identify a valid Break of Structure? A valid BOS requires three conditions: (1) the candle must close beyond the swing point — not just wick through it; (2) the move must show displacement — large, impulsive candles with clear momentum; and (3) the swing level being broken must be a significant structural point, not a minor internal wiggle. Volume above the recent average provides additional confirmation.
Q: What is the difference between a CHoCH and a Market Structure Shift (MSS)? A CHoCH is the first structural break against the current trend — an early warning that may or may not lead to a reversal. An MSS is a CHoCH confirmed with a strong displacement candle — a decisive close beyond the swing point showing institutional conviction. In practice, CHoCH appears first as the warning; MSS confirms the reversal is real.
Q: How do you identify strong vs. weak swing levels? A strong swing level caused a Break of Structure — the move from that level broke a prior structural point. A weak swing level did not — it formed during a pullback but did not originate any BOS. Strong levels tend to hold when retested because institutional orders remain there. Weak levels tend to get swept (liquidity grab) before price reverses from the nearby strong level.
Q: What timeframe should I use for SMC market structure in stock trading? Use the weekly chart for macro bias, the daily chart for trade direction and key swing levels, the 4-hour chart for identifying institutional zones (order blocks, FVGs), and the 15-minute chart for entry confirmation (internal CHoCH or MSS). For US stocks, the daily and 4-hour charts establish your setup; the 15-minute during the New York AM session (9:30–11:00 AM ET) is your execution timeframe.
Q: Can you trade SMC market structure during consolidation? Consolidation is generally a low-probability environment for SMC structure trading. Within a range, BOS and CHoCH signals generate far more false signals because no clear institutional direction has been established. The highest-probability approach: identify the range, mark its high and low as liquidity pools, and wait for a confirmed BOS with displacement out of the range before establishing a directional bias.
Conclusion
Market structure is not the most exciting topic in trading. It doesn't have the visual appeal of a perfectly placed order block or the precision of a fair value gap entry. But it is the most important.
Every profitable SMC trade starts with clear structure. Every losing trade that could have been avoided was entered without it — or with structure misread.
The three things to burn into your process from this guide:
-
Identify the state first — uptrend, downtrend, or range. This is step zero for every analysis session.
-
Know your BOS from your CHoCH — BOS means continue with the trend; CHoCH means pause and watch for confirmation. These two signals are your real-time trend management system.
-
Not all levels are equal — strong levels hold, weak levels get swept. Filter every trade by the strength of the structural level you're working from.
Start with the daily chart. Mark the structure. Identify the last BOS and the most recent swing levels — strong and weak. Check if there's been a CHoCH. Then and only then, move to the lower timeframes to find your zone and your entry.
This process, done consistently, is what makes structure analysis a genuine edge rather than an afterthought.
Related Articles
- Smart Money Concepts: The Complete Mastery Guide — The full SMC framework covering every concept from liquidity and order blocks to the complete 5-step trade execution system
- Order Blocks: The Complete Mastery Guide — How to identify the institutional zones that originate from the BOS moves you've just learned to read
- Fair Value Gaps: The Complete Mastery Guide — The imbalances left behind by the displacement moves that confirm your BOS signals
- Liquidity Sweeps: The Complete Mastery Guide — How to distinguish a genuine BOS from a liquidity sweep that mimics one
- Inducement (IDM): The Complete SMC Guide — Why the first post-BOS pullback is often a trap and how to time your entry correctly
- Premium and Discount Zones: Complete SMC Guide — How to determine whether price is cheap or expensive once you've established your structural bias
Disclaimer: This article is for educational purposes only and does not constitute financial advice. Stock trading involves significant risk. Past performance does not guarantee future results. Always use proper risk management.
Continue Reading

